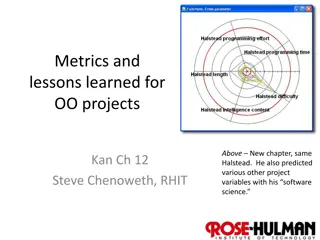
Insights into Born-Digital Archival Workflows Using Metrics
Gain insights into born-digital archival workflows by analyzing data collected over 4 years on 120 projects. Understand workload, processes, and resource needs through time tracking and data analysis. Discover patterns in time taken for ingestion and processing, efficiency improvements, and storage size reductions.

Download Presentation

Please find below an Image/Link to download the presentation.
The content on the website is provided AS IS for your information and personal use only. It may not be sold, licensed, or shared on other websites without obtaining consent from the author. If you encounter any issues during the download, it is possible that the publisher has removed the file from their server.
You are allowed to download the files provided on this website for personal or commercial use, subject to the condition that they are used lawfully. All files are the property of their respective owners.
The content on the website is provided AS IS for your information and personal use only. It may not be sold, licensed, or shared on other websites without obtaining consent from the author.
E N D
Presentation Transcript
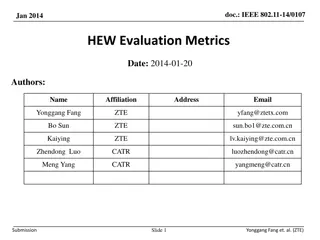
Using metrics to gain insights into born-digital archival workflows Lara Friedman-Shedlov| Digital Records Archivist | ldfs@umn.edu Carol Kussmann | Digital Preservation Analyst |kussmann@umn.edu 1 1 1 1
BACKGROUND Institutional Context Initial motivation for time tracking Electronic Records Management Group Understanding workload Understanding processes Making the case for additional resources ASC Staff from 15 units Digital Records Archivist 2 2 2 2
DATA COLLECTION METHOD Google form feeding into spreadsheet Categories of work Time in minutes Accession tracking log Size at ingest Size after processing 3 3 3 3 3 3 3 3
WHAT WE HOPED THE DATA MIGHT TELL US How long do you think it will take to make the materials accessible? Is there any factor that can be used to estimate the time needed to ingest and process a collection? (Size?) Does the amount of time it takes to complete certain tasks or projects change over time? Evidence of efficiencies developing? 4 4 4 4
LIMITATIONS - DATA COLLECTION Data collection form not designed with research questions in mind Ambiguous task categories Accuracy and granularity of time tracked Work time vs machine time 5 5 5 5
LIMITATIONS - SIZE DATA Tracked by # of bytes (storage space), not the number of files Number of files is not a good indicator of size Zip and/or other archive files Merging multiple accessions for processing accruals into existing collections 6 6 6 6
DATA OVERVIEW 120 projects (accessions/collections) tracked over 4 years o 111 projects ingested 55 projects completely processed Largest 12 TB, smallest 400 KB (at ingest) 40% (46) < 1 GB , 80% (88) <100 GB Only 4 projects > 1 TB Time to completely process ranges from 10 to 3,382 minutes 302 minutes per project (average) .75 minutes per GB (average) Overall reduction of 80% in storage size after processing 7 7 7 7 7
Bigger projects take longer, in general Does size predict time to process? 0-9000 GB 0-3400 minutes Shows all fully processed projects 8
Bigger projects take longer, in general, close up view 0-50 GB 0-950 minutes Shows all fully processed projects up to 50GB at ingest 9
But there are many outliers 0-50 GB 0-950 minutes Shows all fully processed projects up to 50GB at ingest 10
MEDIA TYPE AND NUMBER MATTERS What metrics can be used to estimate the time needed? Media Type/Count Size (GB) Time (min) (transfer/ingest) Project N300 47 510 100 disks MSS095 40 517 75 floppy/optical disks UA2023- 0064 34 390 10 dvds Tretter-361 13 13 1 Network drive SWHA349 32 7 1 Flash drive Projects 10-50 GB at ingest) 11
Did the data show that we got more efficient over time? EFFICIENCY, ALL STEPS Graphs reflects all steps, all projects 12
EFFICIENCY We did harder accessions later Data doesn t reflect different media types/number same size & number of files on many floppies or optical disks vs. 1 hard drive More projects in later years 2020 - 6 projects 2021 - 14 projects 2022 - 40 projects 2023 - 53 projects 13 13 13 13 13
Did the data show that we got more efficient over time? EFFICIENCY, TRANSFERRING TASK Graph reflects one step, all projects 14
CHANGE IN SIZE AFTER PROCESSING - TABLE Processing reduced total storage size by 80% Processing saves storage space Completed Projects Total Tasks Logged Total time Spent in Minutes Total Ingested Size (TB) Total Change in Size from Ingest to Processed (TB) Percent change in size Processed Size (TB) 55 427 16,637 12.12 TB 2.44 TB -9.69 TB -79.9% 15
Original data gathering goal UNDERSTANDING WORKLOAD Identify patterns of which units are processing materials We assume those doing the work: Have resources (staff/time/interest) Comfortable working with digital records Potentially prioritize assisting with units that haven t processed as much 17 17 17 17 17
Original data gathering goal JUSTIFYING ADDITIONAL RESOURCES Optical disk processing improvement Data collected time to ingest optical disks manually Cost of staff time per disk vs. cost of Nimbie disk autoloader Data for time to ingest optical disks with Nimbie shows it cuts ingest time in half Transfer method Average transfer time per disk https://store.acronova.com/nimbie-usb-plus-bd- cd-dvd-autoloader-nb21.html Manually (disk by disk) 8.5 min Autoloader (batch processing) 3.8 min Assessing High-volume Transfers from Optical Media at NYPL, 2021 (https://journal.code4lib.org/articles/15908) 18 18 18 18 18
CONCLUSIONS Difficult to identify factors to estimate the time needed to ingest and process a collection Number/type of media affects ingest time Machine time vs. person time Difficult to track discrete projects (merging happens) Time spent processing to reduce overall size of collections is valuable from a storage and sustainability perspective (80%, ~9TB/3 years) 19 19 19 19 19
SHARING OUR WORK WITH MORE DETAILS Tracking and Analyzing Digital Records Processing Time at the University of Minnesota Archives and Special Collections Background and overview Data analysis Data preparation and review Findings Distribution of project size Storage space and impact of processing Relationship between project size and processing time Efficiency Passive (machine) vs. active time Conclusion 20 20 20 20 20
NEXT STEPS Continue tracking for longitudinal data Refine data collection based on limitations described above Modify to collect / standardize information collecting Track number and types of media ingested Track machine vs active time Re-analyze in a year or two 21 21 21 21 21
FURTHER READING Electronic Records Management Group, University of Minnesota Libraries (2016) Levels of Effort (for Processing Electronic Records at UMN) : https://z.umn.edu/LevelsEffortUMN Shein, Cyndi; Jones, Sarah R.; Kim, Tammi; and Irwin, Karla (2020) Perspectives and Practices: Archival Processing Metrics Survey Findings. Journal of Contemporary Archival Studies: Vol. 7 , Article 16. Shein, Cyndi; Jones, Sarah R.; Kim, Tammi; and Irwin, Karla (2020) "Balancing the Art and Science of Archival Processing Metrics and Assessment," Journal of Western Archives: Vol. 11 : Iss. 1 , Article 1. DOI: https://doi.org/10.26077/3c95-8ef9 Weber, Chela Scott (2020) Time Estimation for Processing Born Digital Collections, Hanging Together: The OCLC Research Blog: https://hangingtogether.org/time- estimation-for-processing-born-digital-collections/ 22 22 22 22 22
QUESTIONS? ldfs@umn.edu kussmann@umn.edu Thanks to Mark Engelmann for assistance with Tableau 23 23 23 23