Insights Into Global Agricultural Machinery Markets
In the agricultural machinery industry, the business climate is favorable with clear upward trends in most regions. The Agritech Business Climate Index shows a positive outlook, indicating increased orders for agricultural machinery. Manufacturers and importers report developments in incoming orders across major markets such as Japan, Korea, China, Turkey, Western Europe, Brazil, and the USA. The data reflects the evolving landscape of the industry and the global demand for farm machinery.

Download Presentation

Please find below an Image/Link to download the presentation.
The content on the website is provided AS IS for your information and personal use only. It may not be sold, licensed, or shared on other websites without obtaining consent from the author.If you encounter any issues during the download, it is possible that the publisher has removed the file from their server.
You are allowed to download the files provided on this website for personal or commercial use, subject to the condition that they are used lawfully. All files are the property of their respective owners.
The content on the website is provided AS IS for your information and personal use only. It may not be sold, licensed, or shared on other websites without obtaining consent from the author.
E N D
Presentation Transcript
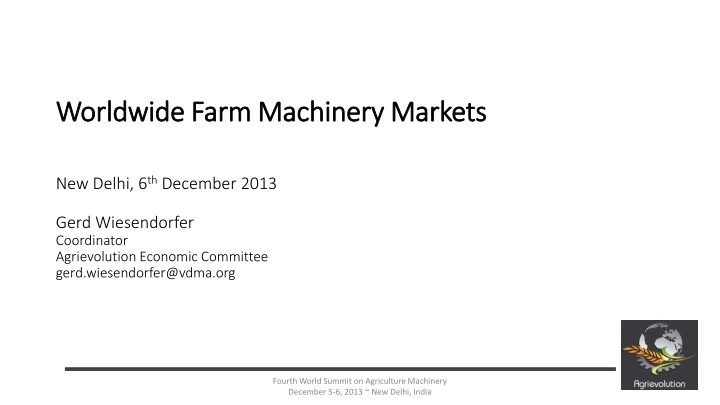
Worldwide Farm Machinery Markets Worldwide Farm Machinery Markets New Delhi, 6thDecember 2013 Gerd Wiesendorfer Coordinator Agrievolution Economic Committee gerd.wiesendorfer@vdma.org Fourth World Summit on Agriculture Machinery December 5-6, 2013 ~ New Delhi, India 1
Business Business climate climate in in the the global global industry industry is is favourable favourable Agritech Business Climate Index Possible range from -100 to +100 80 60 40 20 0 Climate Index -20 Current Situation Future Situation -40 Apr 10 1 -23 26 Oct 10 34 8 61 Apr 11 65 60 71 Oct 11 44 49 38 Apr 12 35 37 33 Oct 12 19 25 13 Apr 13 29 25 33 Oct 13 32 36 27 Climate Index Current Situation Future Situation Source: Agritech Business Barometer, Agrievolution weighted global average Fourth World Summit on Agriculture Machinery ~ December 5- 6, 2013 ~ New Delhi, India 2
with with clear clear upward upwardtrends trends in in most most regions regions Agritech Business Climate Index Possible range from -100 to +100 100 80 60 40 20 0 -20 -40 Oct 10 Apr 11 Oct 11 Apr 12 Oct 12 Apr 13 Oct 13 -60 -80 World* USA Brazil Western Europe Turkey China Korea Japan Source: Agritech Business Barometer Survey, Agrievolution *weighted global average Fourth World Summit on Agriculture Machinery ~ December 5- 6, 2013 ~ New Delhi, India 3
Increasing Increasing orders orders for for agricultural agricultural machinery machinery in in major major markets markets Question: Our volume of incoming orders on our domestic market, compared to the same period a year ago, has developed as follows in the past 3 months: Answers from manufacturers / importers according to location, in % of interviewees more than +40% +21% to +40% +5% to +20% unchanged (+/- 4%) -5% to -20% -21% to -40% more than -40% Japan 8 46 46 Korea 31 44 25 China 7 19 33 14 24 2 Turkey 10 14 24 24 14 14 Western Europe 26 35 35 2 Brazil 9 18 27 36 9 USA 8 8 30 49 5 World* 5 8 29 35 20 2 0% 10% 20% 30% 40% 50% 60% 70% 80% 90% 100% Source: Agritech Business Barometer October 2013, Agrievolution - Western Europe: comparison Oct 13/Oct 12 * weighted global average Fourth World Summit on Agriculture Machinery ~ December 5- 6, 2013 ~ New Delhi, India 4
lead lead to to expansionary expansionary turnover turnover expectations expectations for for the the next next months months. . Question: We expect our overall turnover within the next 6 months to Answers from manufacturers / importers according to location 100% 8 10 15 18 20 24 26 80% decrease 46 20 44 35 50 37 60% 38 39 remain unchanged 40% 61 54 50 grow 46 45 42 20% 38 35 0% World* USA Brazil Western Europe Turkey China Korea Japan Source: Agritech Business Barometer Survey October 2013, Agrievolution * weighted global average Fourth World Summit on Agriculture Machinery ~ December 5- 6, 2013 ~ New Delhi, India 5
Production Production has has experienced experienced a a very very dynamic dynamic phase phase in in the the past past 5 5 years years Development of the agricultural machinery production Index 2008 = 100, based on nominal terms in Euro Average annual growth rates 2009 - 2013 World European Union China North America India Latin America 250 European Union Eastern Europe Japan Latin America World India North America China Turkey 2% 3% 4% 4% 7% 7% 9% 19% 23% 200 150 Fl che f r Grafik 100 50 2009 2010 2011 2012 2013e Source: VDMA (Forecast status October 2013) Fourth World Summit on Agriculture Machinery ~ December 5- 6, 2013 ~ New Delhi, India 6
Regional Regional shifts shifts of of production production with with China China being being a a major major driver driver Shares of global agricultural machinery production in % 100 3,4 2,7 2,8 Others 2,9 3,0 3,1 3,1 3,2 3,4 2,8 2,9 3,8 3,4 2,9 3,4 4,2 3,5 4,5 1,5 3,2 2,4 3,0 3,8 3,8 2,9 4,4 90 3,3 4,7 3,2 4,2 3,8 3,6 3,6 3,9 Japan 4,1 3,9 6,1 5,2 5,0 5,2 5,4 6,0 5,2 4,1 4,7 80 6,0 6,1 5,7 7,4 6,2 7,2 7,0 7,4 5,9 Turkey 70 7,4 8,6 15,3 11,5 11,0 19,3 19,3 17,1 16,1 Eastern Europe 60 India 27,7 26,0 24,1 23,5 50 26,6 24,9 25,3 25,7 26,5 Latin America 40 30 China 20 39,1 39,0 38,8 38,0 North America 34,7 32,8 32,0 31,2 30,6 10 European Union 0 2005 2006 2007 2008 2009 2010 2011 2012 2013e Source: VDMA (estimations), Status October 2013, basis in Euro Fourth World Summit on Agriculture Machinery ~ December 5- 6, 2013 ~ New Delhi, India 7
Strong Strong tractor tractor markets markets 2013: 2013: America America and and Asia Asia New tractor sales (in units) 2008 2009 2010 2011 2012 2013e % Canada United States Brazil Japan (> 22 kW) China (> 18 kW) Korea India Russian Federation Turkey European Union of which: France* of which: Germany of which: Italy of which: United Kingdom 28.865 197.752 43.414 15.629 200.000 15.179 392.000 38.794 27.022 210.504 40.716 31.250 27.261 18.564 23.167 155.262 45.437 15.318 280.000 14.717 403.903 13.292 13.758 184.379 36.800 29.464 27.057 16.326 22.834 164.894 56.420 14.269 320.000 15.603 520.073 21.085 36.072 167.517 29.123 28.587 23.323 14.486 24.117 168.013 52.296 15.246 350.000 15.879 564.699 36.997 60.466 187.352 35.409 35.977 23.431 15.217 25.238 185.167 55.810 16.539 390.000 14.488 534.079 41.811 50.320 188.125 39.089 36.264 19.343 14.964 27.500 202.000 65.000 19.847 440.000 15.000 570.000 39.302 47.000 183.000 42.500 35.500 18.500 13.200 9 9 16 20 13 4 7 -6 -7 -3 9 -2 -4 -12 World 1.500.000 1.450.000 1.700.000 1.900.000 1.950.000 2.050.000 5 * without telehandlers Source: Agrievolution, VDMA (incl. estimations) Fourth World Summit on Agriculture Machinery ~ December 5- 6, 2013 ~ New Delhi, India 8
New New production production and and market market peak peak 2013 2013 Global agricultural machinery production in bn Euro 96 91 81 70 68 62 61 56 54 Fl che f r Grafik 2005 2006 2007 2008 2009 2010 2011 2012 2013e Source: VDMA Agricultural Machinery Association (estimations October 2013) Fourth World Summit on Agriculture Machinery ~ December 5- 6, 2013 ~ New Delhi, India 9
Weaker Weaker drivers but but basic basic economic economic conditions drivers for for new new machinery machinery demand conditions remain demandin Western Europe, in Western Europe, remain favourable favourable Evaluation of economic farming parameters referring to investment in new machinery in Western Europe 2013 2014/ 2013 2014/ 2015 2015 K J K J J K K J K L J L J J K K J J J J K K K L K L J J J K K K Agricultural income Structural change in agriculture Vegetal Production Contractor business Animal Production Capacity increase / enlargement Level of agricultural commodity prices Replacement need for machinery park Input cost Used machinery market Technological innovation / machinery offers Subsidies / agricultural policy General sentiment / uncertainty etc. Interest rates / access to credit loans Special impact (e.g. animal diseases) Alternative investment (outside agriculture) Source: VDMA Fourth World Summit on Agriculture Machinery ~ December 5- 6, 2013 ~ New Delhi, India 10
General General conditions conditions for for the the global global markets markets 2014/2015 2014/2015 Comparatively good prices for agricultural commodities and slightly lower costs Investor s liquidity predominantly on a good level Conditions on the capital market generally good Higher degree of mechanization due to a growing demand for efficiency Structural change increases the demand for high capacity machines Agricultural policy will continue to be a stimulus for investment, following different politcal objectives Emerging markets: Higher degree of mechanization, modernization of fleets East Europe: Self-sufficiency gains (food) and export position (grains) Europe: Promotion of smaller and diversified structures + greening USA: Income stability for farmers and promotion of bioenergy production Fourth World Summit on Agriculture Machinery ~ December 5- 6, 2013 ~ New Delhi, India 11
Decline Decline of of market market and and production production volume volume 2014 2014 remains remains very very limited limited Global agricultural machinery production in bn Euro 96 94 91 81 70 68 62 61 56 54 Fl che f r Grafik 2005 2006 2007 2008 2009 2010 2011 2012 2013e 2014e Source: VDMA Agricultural Machinery Association (estimations October 2013) Fourth World Summit on Agriculture Machinery ~ December 5- 6, 2013 ~ New Delhi, India 12