Insights on End-Stage Renal Disease and Healthy People 2020 Goals
Download Presenatation

This report examines data on End-Stage Renal Disease and progress towards Healthy People 2020 targets. It includes information on acute kidney injury follow-up, diabetes management, and chronic kidney disease evaluation. The data reflects specific goals related to kidney health among different demographic groups.

Download Presentation
Please find below an Image/Link to download the presentation.
The content on the website is provided AS IS for your information and personal use only. It may not be sold, licensed, or shared on other websites without obtaining consent from the author. If you encounter any issues during the download, it is possible that the publisher has removed the file from their server.
You are allowed to download the files provided on this website for personal or commercial use, subject to the condition that they are used lawfully. All files are the property of their respective owners.
The content on the website is provided AS IS for your information and personal use only. It may not be sold, licensed, or shared on other websites without obtaining consent from the author.
E N D
Presentation Transcript
2015 ANNUAL DATA REPORT VOLUME 2: END-STAGE RENAL DISEASE Chapter 2: Healthy People 2020
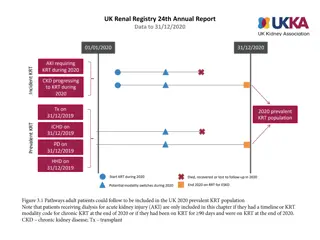
Table 2.1 HP2020 CKD-3 Increase the proportion of hospital patients who incurred acute kidney injury who have follow up renal evaluation in 6 months post discharge: Target 12.2% 2001 (%) 2002 (%) 2003 (%) 2004 (%) 2005 (%) 2006 (%) 2007 (%) 2008 (%) 2009 (%) 2010 (%) 2011 (%) 2012 (%) 2013 (%) All 2.4 3.1 4.4 8.4 9.1 10.5 11.2 10.6 11.5 11.9 12.7 12.8 16.1 Race/Ethnicity American Indian or Alaskan Native only Asian only Black or African American only White only Hispanic or Latino Sex Male Female Age 65-74 75-84 85+ 0.0 0.0 2.9 16.7 4.8 13.2 12.0 15.2 6.9 11.0 16.7 9.5 7.8 3.8 2.0 4.5 8.1 12.8 19.0 15.2 11.5 16.6 15.5 16.0 14.8 22.0 2.9 2.5 4.0 7.8 9.7 9.2 11.2 10.3 12.1 11.3 12.1 13.3 16.2 2.3 3.2 4.5 8.3 8.8 10.5 11.1 10.4 11.2 11.9 12.6 12.6 15.7 1.4 6.6 7.1 12.9 12.2 10.3 12.4 15.6 13.4 13.1 17.2 16.4 23.0 2.8 3.5 4.6 8.8 9.9 11.3 12.6 11.9 12.5 12.8 13.9 13.9 17.6 2.0 2.8 4.3 8.0 8.3 9.7 10.0 9.4 10.6 11.1 11.7 11.9 14.7 3.7 4.2 6.2 11.6 12.8 14.7 16.1 14.8 16.0 16.5 17.6 17.3 21.0 2.0 3.2 4.2 8.5 8.6 10.4 11.1 10.8 11.3 12.4 13.2 13.0 16.8 0.8 1.1 2.2 3.1 4.4 5.1 5.1 5.0 6.4 5.9 6.2 6.9 9.1 Data Source: Special analyses, Medicare 5 percent sample. Medicare patients aged 65 & older with a hospitalized AKI event in a given year. Abbreviation: CKD, chronic kidney disease. Vol 2, ESRD, Ch 2 2
Table 2.2 HP2020 D-12 Increase the proportion of persons with diagnosed diabetes who obtain an annual urinary microalbumin measurement: Target 37.0% 2001 (%) 2002 (%) 2003 (%) 2004 (%) 2005 (%) 2006 (%) 2007 (%) 2008 (%) 2009 (%) 2010 (%) 2011 (%) 2012 (%) 2013 (%) All Race/Ethnicity American Indian or Alaskan Native only Asian only Black or African American only White only Hispanic or Latino Sex Male Female Age 65-74 75-84 85+ 15.3 18.1 21.2 25.5 28.5 31.0 33.3 35.3 36.9 38.6 40.5 42.3 45.0 11.4 12.0 13.0 15.5 18.9 20.2 20.9 21.2 24.0 22.9 24.5 24.0 27.2 16.8 20.6 23.9 28.8 30.5 33.4 34.9 37.3 39.5 41.7 43.8 47.3 49.4 13.1 15.6 18.5 23.5 26.4 29.0 31.5 33.3 35.3 36.9 39.0 40.5 43.1 15.5 18.5 21.6 25.7 28.7 31.2 33.5 35.5 37.1 38.7 40.6 42.3 44.9 15.3 17.8 20.7 25.5 29.6 31.3 33.2 35.2 37.6 40.2 42.3 44.3 47.9 14.8 17.6 20.7 24.7 27.8 30.2 32.4 34.4 36.2 37.7 39.6 41.5 44.0 15.9 18.8 21.9 26.5 29.4 32.0 34.5 36.4 37.9 39.5 41.6 43.3 46.1 18.1 21.2 24.7 29.4 32.6 35.1 37.7 39.9 41.8 43.3 45.3 47.2 49.7 13.7 16.7 19.6 23.8 26.8 29.6 31.8 33.7 35.3 37.1 39.1 41.0 44.4 7.2 9.0 10.9 13.9 16.1 18.1 20.5 22.2 23.5 25.0 26.7 28.0 31.5 Data Source: Special analyses, Medicare 5 percent sample. Medicare patients with diabetes mellitus, aged 65 & older. Abbreviations: D, diabetes mellitus. Vol 2, ESRD, Ch 1 3
Table 2.3 HP2020 CKD-4.1 Increase the proportion of persons with chronic kidney disease who receive medical evaluation with serum creatinine, lipids, and microalbuminuria: Target 28.3% 2001 (%) 2002 (%) 2003 (%) 2004 (%) 2005 (%) 2006 (%) 2007 (%) 2008 (%) 2009 (%) 2010 (%) 2011 (%) 2012 (%) 2013 (%) All Race/Ethnicity 7.3 9.1 10.6 19.8 22.1 23.4 25.7 26.7 28.1 29.0 30.2 31.1 33.1 American Indian or Alaskan Native only 8.2 5.5 7.0 13.7 19.2 15.8 16.9 16.7 18.3 20.2 21.0 18.4 23.4 Asian only Black or African American only White only Hispanic or Latino Sex Male Female Age 65-74 75-84 85+ 8.4 14.4 14.1 27.6 27.9 32.5 35.3 34.0 37.5 36.9 39.5 41.2 43.9 6.6 8.7 10.1 20.8 22.8 24.4 26.7 27.8 30.1 30.6 32.3 33.1 35.0 7.1 8.8 10.4 19.3 21.6 22.9 25.1 26.3 27.4 28.3 29.4 30.3 32.2 13.1 17.3 17.7 26.8 30.4 31.1 33.1 32.1 36.1 36.7 38.9 41.2 44.2 7.0 8.9 10.0 18.6 20.9 22.4 24.4 25.2 26.7 27.6 28.6 29.5 31.4 7.5 9.3 11.3 21.1 23.4 24.5 27.1 28.4 29.6 30.6 32.0 33.0 35.1 10.3 12.6 14.2 26.1 29.2 31.4 33.9 35.1 36.7 37.6 38.9 39.9 41.5 6.2 8.0 9.8 18.5 20.8 22.6 24.9 26.2 27.7 28.9 30.3 31.2 33.7 2.3 3.1 4.0 8.2 10.0 10.1 12.1 13.1 14.0 14.8 16.2 17.0 18.6 Data Source: Special analyses, Medicare 5 percent sample. Medicare patients aged 65 & older with CKD. Abbreviations: CKD, chronic kidney disease. Vol 2, ESRD, Ch 1 4
Table 2.4 HP2020 CKD-4.2 Increase the proportion of persons with type 1 or type 2 diabetes and chronic kidney disease who receive medical evaluation with serum creatinine, microalbuminuria, A1c, lipids, and eye examinations: Target 25.3% 2001 (%) 2002 (%) 2003 (%) 2004 (%) 2005 (%) 2006 (%) 2007 (%) 2008 (%) 2009 (%) 2010 (%) 2011 (%) 2012 (%) 2013 (%) All Race/Ethnicity 9.0 10.4 12.1 18.4 20.0 21.1 23.0 23.7 25.1 26.5 26.9 27.6 29.9 American Indian or Alaskan Native only 7.3 2.4 5.7 5.6 15.8 12.5 10.2 10.9 10.9 15.1 14.2 11.2 16.3 Asian only Black or African American only White only Hispanic or Latino Sex Male Female Age 65-74 75-84 85+ 8.3 12.4 12.8 25.0 21.8 26.1 26.7 25.3 27.0 29.6 30.8 32.4 37.0 6.7 7.2 9.9 16.3 17.9 18.8 19.7 21.1 22.4 23.8 25.1 25.3 27.1 9.4 11.0 12.5 18.6 20.3 21.4 23.4 24.2 25.6 27.0 27.1 27.9 30.0 10.4 11.8 11.8 20.5 20.2 19.8 22.2 21.7 24.6 24.0 26.5 25.2 29.8 8.7 10.3 11.8 18.0 19.7 20.9 22.5 23.6 24.7 26.2 26.6 27.5 29.4 9.3 10.6 12.4 18.8 20.3 21.4 23.5 23.7 25.6 26.8 27.3 27.8 30.3 10.9 12.3 14.3 22.0 23.4 24.6 26.6 27.2 28.5 30.0 30.1 30.7 32.7 8.1 9.9 11.6 16.9 18.9 20.7 22.6 23.3 25.2 26.7 27.4 28.4 30.8 4.0 4.2 4.9 9.5 11.5 11.3 13.0 14.2 15.5 16.6 17.7 18.3 20.5 Data Source: Special analyses, Medicare 5 percent sample. Medicare patients aged 65 & older with CKD & diabetes mellitus. Abbreviations: CKD, chronic kidney disease; A1c, glycosylated hemoglobin. Vol 2, ESRD, Ch 1 5
Table 2.5 HP2020 CKD-8 Reduce the rate of new cases of end-stage renal disease (ESRD): Target 344.3 new cases per million population 2001 2002 2003 2004 2005 2006 2007 2008 2009 2010 2011 2012 2013 All Race American Indian or Alaskan Native only Asian only Native Hawaiian or other Pacific Islander only~ Black or African American only White only Two or more races Ethnicity Hispanic or Latino Not Hispanic or Latino Black or African American only, not Hispanic or Latino White only, not Hispanic or Latino 387.9 388.8 388.7 388.2 391.3 399.0 391.1 386.6 389.3 381.5 364.7 356.9 354.5 709.5 672.0 622.4 633.6 609.0 524.8 538.0 543.4 527.8 487.6 457.3 462.6 403.7 319.5 312.7 304.2 281.9 336.5 354.5 356.3 354.6 363.6 353.0 345.0 332.4 325.0 3430. 3547. 3552. 3716. 2902. 2830. 2388. 2175. 2420. 2578. 2356. 2465. 2523. 6 7 0 5 8 5 6 3 5 2 9 1 9 1126. 1134. 1131. 1093. 1103. 1113. 1091. 1072. 1070. 1031. 989.1 939.6 915.3 0 1 7 8 1 9 6 7 5 1 292.0 293.3 293.3 298.0 301.8 311.6 306.0 303.3 306.6 303.2 289.9 284.4 282.5 . . . . . 146.6 149.9 158.2 145.1 140.8 113.3 17.1 3.8 632.9 643.2 640.9 618.4 603.5 604.2 589.6 586.4 583.5 576.7 563.9 528.0 515.4 372.8 373.1 374.1 375.2 377.9 383.4 376.5 373.0 377.3 370.0 354.0 352.9 354.9 1143. 1153. 1152. 1111. 1122. 1134. 1114. 1095. 1093. 1054. 1011. 962.9 939.9 9 5 0 2 6 8 3 7 6 5 0 268.9 268.1 268.2 274.2 276.2 281.9 276.2 272.5 275.3 270.9 256.7 254.4 253.4 (Continued on next slide) Vol 2, ESRD, Ch 1 6
Table 2.5 HP2020 CKD-8 Reduce the rate of new cases of end-stage renal disease (ESRD): Target 344.3 new cases per million population (Continued) 2001 2002 2003 2004 2005 2006 2007 2008 2009 2010 2011 2012 2013 Sex Male Female Age <18 0-4 5-11 12-17 18-44 18-24 25-44 45-64 45-54 55-64 463.7 470.2 469.3 477.3 483.6 494.4 486.7 483.8 488.3 480.1 459.6 448.9 448.0 327.1 323.9 324.8 317.1 317.7 322.4 314.9 309.0 310.0 302.2 287.7 282.2 278.4 11.6 11.9 12.0 12.5 12.3 11.3 12.1 11.9 11.7 11.3 11.4 11.3 10.8 8.9 7.8 9.2 10.9 10.0 8.8 10.9 10.1 10.4 10.7 10.8 11.4 10.5 7.6 8.9 7.6 7.9 7.8 6.5 6.9 7.5 7.1 7.0 6.7 7.2 7.5 18.4 18.7 19.6 19.4 19.6 18.9 19.2 18.7 18.1 16.7 17.3 16.1 14.9 112.5 111.8 110.8 112.0 116.9 120.8 119.2 118.4 121.8 118.1 114.5 112.6 113.0 43.6 41.9 41.9 39.4 41.9 43.3 42.4 41.0 40.1 39.0 39.2 35.6 36.3 136.6 136.3 134.9 137.4 143.2 147.9 146.1 145.5 150.4 145.8 140.8 139.5 139.9 615.1 605.7 606.8 600.3 600.9 612.2 597.6 592.9 592.2 574.8 554.4 551.3 546.2 388.8 388.1 390.1 388.1 386.3 403.2 390.2 386.2 388.2 372.9 370.4 365.5 375.4 841.4 823.3 823.5 812.5 815.6 821.3 805.0 799.6 796.2 776.8 738.3 737.0 716.9 65+ 1580.1 1626.0 1614.8 1611.7 1628.7 1654.3 1622.4 1598.8 1608.2 1599.3 1517.8 1451.6 1438.7 65-74 1436.3 1426.7 1406.8 1397.6 1384.0 1413.2 1379.3 1351.7 1358.4 1351.8 1267.8 1230.7 1224.8 75-84 1756.0 1853.7 1843.7 1844.6 1889.8 1913.0 1876.8 1853.2 1864.0 1859.1 1783.0 1687.0 1674.4 85+ 1259.2 1341.2 1406.0 1424.0 1463.6 1478.7 1508.6 1525.0 1547.8 1477.3 1365.0 1306.4 1221.2 Data Source: Special analyses, USRDS ESRD Database and CDC Bridged Race Intercensal Estimates Dataset, Incident ESRD patients. Rates adjusted for: overall, age/sex/race; rates by age adjusted for sex/race; rates by sex adjusted for age/race; rates by race/ethnicity adjusted for age/sex. Reference: 2012 patients. . Zero values in this cell. ~Estimate shown is imprecise due to small sample size and may be unstable over time. Abbreviations: CDC, Centers for Disease Control and Prevention; CKD, chronic kidney disease; ESRD, end-stage renal disease. Vol 2, ESRD, Ch 1 7
Table 2.6 HP2020 CKD-9.1 Reduce kidney failure due to diabetes: Target 150.6 per million population 2001 177.9 2002 175.2 2003 174.4 2004 174.2 2005 174.2 2006 177.6 2007 171.7 2008 169.1 2009 169.6 2010 166.9 2011 159.5 2012 156.4 2013 155.9 All Race American Indian or Alaskan Native only Asian only Native Hawaiian or other Pacific Islander only~ Black or African American only White only Two or more races Ethnicity Hispanic or Latino Not Hispanic or Latino Black or African American only, not Hispanic or Latino White only, not Hispanic or Latino 526.0 494.4 469.3 478.9 431.1 366.4 378.8 391.1 384.3 347.5 321.5 320.9 291.6 151.7 142.5 139.7 128.9 159.7 177.2 172.7 179.7 180.0 172.3 172.4 167.5 167.9 2190.5 2000.1 2019.7 2256.4 1699.7 1729.3 1490.5 1309.2 1537.5 1618.0 1446.7 1480.8 1626.3 525.9 520.2 511.2 496.4 497.1 502.9 478.5 474.2 471.4 456.9 435.4 407.2 392.7 133.3 132.0 132.2 134.2 135.1 139.6 136.3 134.0 135.0 134.4 129.1 128.8 130.0 . . . . . 74.7 80.8 78.6 77.1 69.4 58.2 7.8 * 404.5 407.4 407.5 393.8 377.7 375.5 366.2 367.7 359.8 355.8 346.1 320.5 308.2 164.7 161.9 161.3 162.1 162.0 164.4 158.9 156.5 157.8 155.2 148.1 146.4 146.8 533.8 528.2 518.7 503.3 504.9 510.5 487.0 482.7 480.4 465.6 443.4 416.6 402.3 114.8 112.5 112.2 114.6 114.6 116.7 113.2 109.5 110.4 109.2 103.5 105.0 107.0 (Continued on next slide) Vol 2, ESRD, Ch 1 8
Table 2.6 HP2020 CKD-9.1 Reduce kidney failure due to diabetes: Target 150.6 per million population (Continued) 2001 2002 2003 2004 2005 2006 2007 2008 2009 2010 2011 2012 2013 Sex Male Female Age <18 0-4 5-11 12-17 18-44 18-24 25-44 45-64 45-54 55-64 65+ 65-74 75-84 85+ 194.2 195.1 195.0 200.5 202.0 206.9 202.3 200.9 203.1 200.7 193.1 189.3 190.5 163.9 158.4 157.1 152.1 150.9 152.8 146.1 142.5 141.5 138.4 131.2 128.3 126.6 0.1 0.1 * 0.1 0.1 * * * 0.1 0.1 * 0.1 0.1 * * * * * * * * * * * * * . * . . * . . * . . . * . * * * * 0.2 * * * * * * * * 33.6 32.7 33.4 34.4 35.2 38.4 37.9 37.6 40.0 39.6 39.7 37.7 38.6 3.6 2.9 2.9 2.1 3.1 3.1 2.7 2.4 2.6 2.5 2.3 2.5 2.4 44.1 43.1 44.0 45.7 46.4 50.7 50.2 49.9 53.1 52.6 52.8 50.1 51.2 343.7 333.7 329.4 323.9 323.2 324.0 310.5 308.8 306.9 295.2 281.1 281.3 275.1 190.9 188.8 187.2 185.1 183.0 189.7 179.2 178.9 180.2 175.6 173.1 173.8 178.4 496.6 478.7 471.7 462.6 463.4 458.3 441.7 438.7 433.7 414.9 389.1 388.8 371.8 678.5 689.8 683.1 690.0 693.8 706.7 691.2 674.4 673.7 679.2 646.5 611.6 616.6 748.3 736.3 728.5 721.6 711.2 725.9 698.5 678.5 675.4 669.0 631.1 608.6 608.0 649.1 682.5 674.3 692.8 712.8 722.2 716.4 699.9 700.4 719.1 690.7 641.0 654.1 274.5 297.8 317.8 344.5 328.8 359.1 366.7 378.6 389.5 383.2 358.3 348.2 327.0 Data Source: Special analyses, USRDS ESRD Database and CDC Bridged Race Intercensal Estimates Dataset, Incident ESRD patients. Adjusted for age/sex/race; reference: 2012. . Zero values in this cell. *Values for cells with 10 or fewer patients are suppressed. ~Estimate shown is imprecise due to small sample size and may be unstable over time. Abbreviations: CDC, Centers for Disease Control and Prevention; CKD, chronic kidney disease; ESRD, end-stage renal disease. Vol 2, ESRD, Ch 1 9
Table 2.7 HP2020 CKD-9.2 Reduce kidney failure due to diabetes among persons with diabetes: Target 2,380.5 per million population 2007 2008 2009 2010 2011 2012 2013 All 2616 2486 2401 2344 2271 2242 2073 Race American Indian or Alaskan Native only 2559 2926 2931 2594 2246 2273 1774 Asian only Native Hawaiian or other Pacific Islander only~ Black or African American only White only 2067 2185 2207 2106 2070 2130 2079 . . . . . . . 4476 4335 4242 3978 3820 3662 3181 2276 2138 2047 2025 1971 1965 1845 Two or more races 610 553 517 484 463 59 * Ethnicity Hispanic or Latino Not Hispanic or Latino 3313 3177 2960 2898 2900 2770 2408 2518 2391 2321 2261 2179 2156 2015 Black or African American only, not Hispanic or Latino 4686 4528 4473 4191 4057 3865 3342 White only, not Hispanic or Latino 2049 1899 1822 1799 1729 1749 1676 (Continued on next slide) Vol 2, ESRD, Ch 1 10
Table 2.7 HP2020 CKD-9.2 Reduce kidney failure due to diabetes among persons with diabetes: Target 2,380.5 per million population (Continued) 2007 2008 2009 2010 2011 2012 2013 Sex Male 2927 2744 2621 2541 2521 2514 2339 Female 2327 2235 2177 2139 2019 1971 1806 Age <18 * * 30 35 * 54 56 0-4 . . . . . . . 5-11 * . . . . * . 12-17 * * * * * * * 18-44 1613 1531 1507 1461 1557 1494 1532 18-24 341 268 285 290 334 295 267 25-44 1748 1677 1642 1578 1665 1628 1682 45-64 2377 2257 2195 2134 2068 2093 2078 45-54 2005 1846 1854 1864 1875 1869 1919 55-64 2643 2571 2436 2308 2179 2231 2172 65+ 3101 2939 2800 2720 2574 2487 2507 65-74 3186 2990 2894 2771 2619 2543 2565 75-84 3351 3156 2934 2873 2799 2695 2807 85+ 1946 2073 1976 2073 1765 1691 1485 Data Source: Special analyses, USRDS ESRD Database and CDC Bridged Race Intercensal Estimates Dataset, Incident ESRD patients. Adjusted for age/sex/race; Ref: 2012. National Health Interview Survey 2006 2013 used to estimate diabetes mellitus prevalence. . Zero values in this cell; *Values for cells with 10 or fewer patients are suppressed. Abbreviations: CDC, Centers for Disease Control and Prevention; CKD, chronic kidney disease; ESRD, end-stage renal disease; Ref, reference. Vol 2, ESRD, Ch 1 11
Table 2.8 HP2020 CKD-10 Increase the proportion of chronic kidney disease patients receiving care from a nephrologist at least 12 months before the start of renal replacement therapy: Target 29.8% 2005 (%) 2006 (%) 2007 (%) 2008 (%) 2009 (%) 2010 (%) 2011 (%) 2012 (%) 2013 (%) All Race American Indian or Alaskan Native only Asian only Native Hawaiian or other Pacific Islander only Black or African American only White only Two or more races Ethnicity Hispanic or Latino Not Hispanic or Latino Black or African American only, not Hispanic/Latino White only, not Hispanic or Latino 25.7 26.5 27.3 28.6 28.6 29.6 31.0 33.1 34.3 25.3 27.2 26.1 27.9 26.9 23.8 27.8 30.2 30.5 25.9 23.8 26.6 27.6 29.1 29.8 31.4 31.9 35.5 23.5 25.2 23.9 22.5 24.0 25.4 27.0 27.5 30.1 22.1 23.2 24.0 24.7 24.9 25.5 27.2 29.6 30.2 27.3 28.0 28.8 30.4 30.2 31.3 32.7 34.7 35.9 23.0 22.7 24.6 29.1 28.6 31.4 31.5 33.3 45.5 20.0 21.3 21.3 22.3 22.6 23.7 25.1 25.8 27.1 26.6 27.2 28.2 29.6 29.5 30.5 32.1 34.3 35.5 22.2 23.2 24.1 24.7 25.0 25.6 27.2 29.7 30.3 28.8 29.4 30.5 32.2 32.0 33.3 34.7 37.0 38.2 (Continued on next slide) Vol 2, ESRD, Ch 1 12
Table 2.8 HP2020 CKD-10 Increase the proportion of chronic kidney disease patients receiving care from a nephrologist at least 12 months before the start of renal replacement therapy: Target 29.8% (Continued) 2005 (%) 2006 (%) 2007 (%) 2008 (%) 2009 (%) 2010 (%) 2011 (%) 2012 (%) 2013 (%) Sex Male Female Age <18 0-4 5-11 12-17 18-44 18-24 25-44 45-64 45-54 55-64 65+ 65-74 75-84 85+ 26.1 26.5 27.3 28.4 28.4 29.6 30.8 33.1 34.2 25.3 26.4 27.3 28.8 28.9 29.5 31.4 33.1 34.4 39.8 36.0 35.2 40.0 39.5 37.6 44.7 40.8 46.1 25.0 20.3 25.7 26.7 23.5 22.7 25.0 27.3 29.2 50.5 48.6 41.1 53.1 48.0 48.8 59.4 51.5 57.7 41.4 36.8 36.9 40.3 42.4 39.5 47.5 42.7 48.4 23.3 23.0 23.6 24.4 23.9 24.3 25.7 27.8 27.6 24.6 23.2 24.9 23.9 24.7 25.4 27.6 26.6 28.0 23.1 23.0 23.5 24.4 23.8 24.2 25.5 27.9 27.6 25.7 26.1 26.7 27.3 27.4 27.9 29.5 31.1 32.1 24.0 25.0 25.5 25.3 25.8 26.2 28.4 29.5 30.6 26.8 26.9 27.4 28.6 28.5 29.0 30.1 32.1 33.0 26.2 27.5 28.6 30.5 30.5 32.0 33.4 35.9 37.4 27.1 28.4 28.9 30.6 30.7 32.1 33.4 35.6 36.8 26.0 27.3 28.9 31.2 30.9 32.7 33.9 36.7 38.4 22.9 24.2 26.7 27.6 28.3 29.7 31.5 34.1 36.4 Data Source: Special analyses, Medicare 5 percent sample. Incident hemodialysis patients with a valid ESRD Medical Evidence CMS 2728 form; nephrologist care determined from Medical Evidence form. Abbreviations: CMS, Centers for Medicare and Medicaid Services; CKD, chronic kidney disease; ESRD, end-stage renal disease. Vol 2, ESRD, Ch 1 13
Figure 2.1 HP2020 CKD-10 Geographic distribution of the adjusted proportion of chronic kidney disease patients receiving care from a nephrologist at least 12 months before the start of renal replacement therapy, by state, in the U.S. population, 2013: Target 29.8% Data Source: Special analyses, Medicare 5 percent sample. Incident hemodialysis patients with a valid ESRD Medical Evidence CMS 2728 form; nephrologist care determined from Medical Evidence form. Adjusted for age, sex, and race. Abbreviations: CDC, Centers for Disease Control and Prevention; CKD, chronic kidney disease; ESRD, end-stage renal disease. Vol 2, ESRD, Ch 1 14
Table 2.9 HP2020 CKD-11.1: Increase the proportion of adult hemodialysis patients who use arteriovenous fistulas as the primary mode of vascular access: Previous data source target 50.6% 2012 2013 All 61.4 62.8 Race American Indian or Alaskan Native only 71.8 74.2 Asian only 65.8 67.3 Native Hawaiian or other Pacific Islander only 65.2 67.7 Black or African American only 56.4 57.8 White only 63.8 65.2 Two or more races 67.6 68.6 Ethnicity Hispanic or Latino 66.7 67.9 Not Hispanic or Latino 60.2 61.7 Black or African American only, not Hispanic/Latino 56.3 57.8 White only, not Hispanic or Latino 62.5 64.0 (Continued on next slide) Vol 2, ESRD, Ch 1 15
Table 2.9 HP2020 CKD-11.1: Increase the proportion of adult hemodialysis patients who use arteriovenous fistulas as the primary mode of vascular access: Previous data source target 50.6% (Continued) 2012 2013 Sex Male 67.7 68.8 Female 53.2 55.1 Age 18-44 65.3 66.3 18-24 64.5 66.1 25-44 65.4 66.3 45-64 63.4 64.9 45-54 65.1 66.4 55-64 62.3 63.8 65+ 57.6 59.2 65-74 59.8 61.4 75-84 56.5 57.9 85+ 47.5 48.9 Data Source: Special analyses, CROWNWeb. Prevalent hemodialysis patients with a valid ESRD Medical Evidence CMS 2728 form, vascular access type determined from CROWNWeb. Abbreviations: CMS, Centers for Medicare and Medicaid Services; CKD, chronic kidney disease; ESRD, end-stage renal disease. Vol 2, ESRD, Ch 1 16
Table 2.10 HP2020 CKD-11.2: Reduce the proportion of adult hemodialysis patients who use catheters as the only mode of vascular access: Previous data source target 26.1% 2012 2013 All 15.9 15.1 Race American Indian or Alaskan Native only 12.7 11.7 Asian only 13.9 13.3 Native Hawaiian or other Pacific Islander only 14.7 14.2 Black or African American only 15.0 14.3 White only 16.7 16.0 Two or more races 11.4 10.0 Ethnicity Hispanic or Latino 13.9 13.4 Not Hispanic or Latino 16.3 15.5 Black or African American only, not Hispanic/Latino 14.9 14.2 White only, not Hispanic or Latino 17.8 17.1 (Continued on next slide) Vol 2, ESRD, Ch 1 17
Table 2.10 HP2020 CKD-11.2: Reduce the proportion of adult hemodialysis patients who use catheters as the only mode of vascular access: Previous data source target 26.1% (Continued) 2012 2013 Sex Male 13.8 13.3 Female 18.5 17.5 Age 18-44 14.9 14.2 18-24 17.9 16.4 25-44 14.6 13.9 45-64 14.5 13.9 45-54 13.8 13.2 55-64 15.0 14.4 65+ 17.6 16.9 65-74 15.7 15.2 75-84 18.4 17.7 85+ 27.6 26.7 Data Source: Special analyses, CROWNWeb. Prevalent hemodialysis patients with a valid ESRD Medical Evidence CMS 2728 form, vascular access type determined from CROWNWeb. Abbreviations: CMS, Centers for Medicare and Medicaid Services; CKD, chronic kidney disease; ESRD, end-stage renal disease. Vol 2, ESRD, Ch 1 18
Table 2.11 HP2020 CKD-11.3 Increase the proportion of adult hemodialysis patients who use arteriovenous fistulas or have a maturing fistula as the primary mode of vascular access at the start of renal replacement therapy: Target 34.5% 2005 (%) 31.1 2006 (%) 31.9 2007 (%) 31.6 2008 (%) 31.2 2009 (%) 32.3 2010 (%) 33.8 2011 (%) 35.1 2012 (%) 36.6 2013 (%) 37.2 All Race American Indian or Alaskan Native only Asian only Native Hawaiian or other Pacific Islander only Black or African American only White only Two or more races Ethnicity Hispanic or Latino Not Hispanic or Latino Black or African American only, not Hispanic or Latino White only, not Hispanic or Latino 36.2 39.1 37.6 41.4 41.4 41.1 40.2 40.8 42.4 36.0 37.5 35.2 35.9 35.5 37.4 37.1 38.0 41.3 41.0 34.7 35.4 32.9 32.4 32.4 36.0 37.7 39.5 28.4 29.3 29.7 29.2 30.6 32.0 33.9 35.8 35.6 31.9 32.7 32.1 31.7 32.7 34.3 35.3 36.8 37.5 25.8 36.4 33.2 28.9 36.1 37.8 39.1 42.9 33.3 31.4 32.3 29.9 29.7 31.0 32.8 33.4 34.2 34.8 31.0 31.9 31.9 31.4 32.5 34.0 35.4 37.1 37.6 28.3 29.2 29.7 29.1 30.6 31.9 33.9 35.8 35.6 32.0 32.9 32.7 32.3 33.1 34.8 36.0 37.7 38.4 (Continued on next slide) Vol 2, ESRD, Ch 1 19
Table 2.11 HP2020 CKD-11.3 Increase the proportion of adult hemodialysis patients who use arteriovenous fistulas or have a maturing fistula as the primary mode of vascular access at the start of renal replacement therapy: Target 34.5% (Continued) 2005 (%) 2006 (%) 2007 (%) 2008 (%) 2009 (%) 2010 (%) 2011 (%) 2012 (%) 2013 (%) Sex Male Female Age 18-44 18-24 25-44 45-64 45-54 55-64 65+ 65-74 75-84 85+ 34.9 35.1 34.8 33.9 34.9 36.4 37.8 39.1 39.2 26.3 27.9 27.4 27.6 28.8 30.4 31.4 33.3 34.4 29.5 29.5 28.2 27.5 29.2 31.1 31.9 32.5 33.0 25.6 22.3 20.2 21.0 22.7 23.6 25.0 25.4 28.1 29.9 30.3 29.0 28.2 29.8 31.8 32.6 33.1 33.5 33.2 33.3 32.6 32.5 33.2 34.4 35.9 37.8 37.8 32.4 33.1 32.4 32.2 32.8 34.0 35.9 37.1 37.4 33.8 33.5 32.7 32.7 33.5 34.6 35.9 38.2 38.1 29.9 31.4 31.6 31.0 32.2 34.0 35.1 36.6 37.6 31.7 33.5 34.0 32.9 34.3 35.9 37.0 38.7 39.1 29.4 30.6 30.5 30.7 31.8 33.7 34.8 36.0 37.7 23.7 25.0 25.1 24.0 25.3 26.6 28.3 29.1 29.9 Data Source: Special analyses, Medicare 5 percent sample. Incident hemodialysis patients aged 18 & older. Abbreviations: CKD, chronic kidney disease. Vol 2, ESRD, Ch 1 20
Table 2.12 HP2020 CKD-12 Increase the proportion of dialysis patients waitlisted and/or receiving a deceased donor kidney transplant within 1 year of end-stage renal disease (ESRD) start (among patients under 70 years of age): Target 18.4% of dialysis patients 2000 (%) 15.2 2001 (%) 14.5 2002 (%) 14.5 2003 (%) 14.5 2004 (%) 15.3 2005 (%) 15.8 2006 (%) 16.9 2007 (%) 17.0 2008 (%) 16.7 2009 (%) 17.2 2010 (%) 16.9 2011 (%) 17.5 2012 (%) 17.7 2013 (%) 18.0 All Race American Indian or Alaskan Native only Asian only Native Hawaiian or other Pacific Islander only Black or African American only White only Two or more races Ethnicity Hispanic or Latino Not Hispanic or Latino Black or African American only, not Hispanic or Latino White only, not Hispanic or Latino 12.9 9.7 10.1 9.5 10.3 10.9 10.4 11.4 10.5 11.5 11.4 11.3 12.3 12.4 26.8 28.7 28.2 28.3 32.2 28.2 31.3 30.8 31.1 32.0 32.0 33.0 32.1 34.1 17.4 17.3 18.7 19.6 18.2 16.1 15.1 14.9 14.3 14.8 15.2 14.8 16.9 18.3 11.2 10.5 10.7 10.5 11.6 12.0 13.1 13.3 13.2 13.9 13.8 14.4 14.8 15.0 17.0 16.2 16.1 16.3 16.7 17.5 18.4 18.5 18.1 18.2 17.8 18.5 18.6 19.0 14.0 19.4 13.8 23.5 23.9 23.0 17.6 20.5 37.5 12.9 12.7 13.3 14.1 14.5 15.7 17.6 17.7 17.3 18.2 17.5 18.4 18.1 18.2 15.5 14.8 14.6 14.6 15.4 15.8 16.7 16.8 16.6 16.9 16.7 17.2 17.5 17.9 11.2 10.5 10.7 10.5 11.6 11.9 13.0 13.2 13.2 13.8 13.8 14.4 14.8 14.9 18.0 17.1 16.8 16.7 17.2 18.0 18.7 18.8 18.3 18.2 17.9 18.3 18.7 19.3 (Continued on next slide) Vol 2, ESRD, Ch 1 21
Table 2.12 HP2020 CKD-12 Increase the proportion of dialysis patients waitlisted and/or receiving a deceased donor kidney transplant within 1 year of end-stage renal disease (ESRD) start (among patients under 70 years of age): Target 18.4% of dialysis patients (Continued) 2000 (%) 2001 (%) 2002 (%) 2003 (%) 2004 (%) 2005 (%) 2006 (%) 2007 (%) 2008 (%) 2009 (%) 2010 (%) 2011 (%) 2012 (%) 2013 (%) Sex Male Female Age <18 0-4 5-11 12-17 18-44 18-24 25-44 45-64 45-54 55-64 65+ 65-69 13.4 13.4 12.7 13.0 13.6 14.2 15.3 15.7 15.6 15.8 15.7 16.3 16.5 17.1 16.4 15.2 15.7 15.5 16.4 16.8 17.9 17.8 17.4 18.0 17.7 18.3 18.7 18.9 41.9 40.2 40.8 48.9 44.9 52.7 58.2 56.0 59.0 58.2 55.3 54.0 55.1 56.6 24.0 26.1 31.5 39.1 30.9 34.5 40.9 36.5 40.1 44.3 37.7 34.4 29.6 35.5 42.2 49.2 44.2 50.0 50.7 63.6 61.5 65.1 66.6 64.2 60.3 62.6 62.5 67.4 47.1 40.0 41.6 51.2 47.3 53.6 62.7 59.4 63.2 61.3 60.9 58.6 64.4 61.8 26.4 25.2 24.5 23.8 25.2 24.9 26.2 25.6 25.3 25.9 25.2 27.0 26.2 27.4 30.5 29.1 30.2 29.5 33.5 27.8 32.4 32.0 30.0 32.5 32.6 33.5 34.0 38.6 26.0 24.9 23.9 23.3 24.5 24.6 25.7 25.0 24.9 25.3 24.5 26.4 25.5 26.3 14.1 13.4 13.4 13.5 14.0 14.6 15.7 15.9 15.5 15.8 15.7 16.3 16.8 16.7 18.2 17.4 17.1 16.6 16.8 16.8 18.3 18.6 17.2 18.3 17.9 18.6 19.1 19.1 11.2 10.5 10.7 11.4 12.1 13.1 13.8 14.1 14.3 14.2 14.3 14.9 15.4 15.2 5.0 5.3 6.0 6.2 7.4 8.0 8.9 9.4 9.9 10.9 10.9 10.8 10.9 12.1 5.0 5.3 6.0 6.2 7.4 8.0 8.9 9.4 9.9 10.9 10.9 10.8 10.9 12.1 Data Source: Special analyses, Medicare 5 percent sample. Incident ESRD patients younger than 70. Abbreviations: CKD, chronic kidney disease; ESRD, end-stage renal disease. Vol 2, ESRD, Ch 1 22
Table 2.13 HP2020 CKD-13.1 Increase the proportion of patients receiving a kidney transplant within 3 years of end-stage renal disease (ESRD): Target 19.7% 1998 (%) 1999 (%) 2000 (%) 2001 (%) 2002 (%) 2003 (%) 2004 (%) 2005 (%) 2006 (%) 2007 (%) 2008 (%) 2009 (%) 2010 (%) All Race American Indian or Alaskan Native only Asian only Native Hawaiian or other Pacific Islander only Black or African American only White only Two or more races Ethnicity Hispanic or Latino Not Hispanic or Latino Black or African American only, not Hispanic or Latino White only, not Hispanic or Latino 19.9 19.4 19.1 18.3 18.3 18.0 18.2 17.6 17.1 16.6 15.6 14.6 14.1 11.3 10.0 15.4 8.7 11.6 8.8 9.1 8.7 10.0 10.1 6.7 7.2 7.2 18.8 17.8 18.3 18.1 20.8 21.4 20.3 18.2 18.7 17.4 17.8 16.7 17.2 12.3 12.8 8.3 12.6 12.0 11.4 12.5 9.4 9.7 10.5 10.5 8.2 7.3 9.8 9.5 9.8 8.8 9.5 9.2 9.9 9.5 8.9 9.0 8.6 7.7 7.6 26.3 25.2 24.4 23.7 23.1 22.8 22.6 22.0 16.4 21.3 16.5 20.6 14.6 19.2 17.6 18.0 17.0 17.1 14.4 16.7 14.7 15.0 14.2 14.0 14.4 14.7 14.7 14.5 13.8 12.5 11.7 11.2 20.0 19.6 19.4 18.6 18.8 18.3 18.5 17.9 17.2 16.8 15.9 14.8 14.3 9.7 9.4 9.8 8.7 9.5 9.1 9.9 9.5 8.9 8.9 8.5 7.6 7.5 28.3 27.8 26.9 26.3 25.9 25.3 24.9 24.3 23.7 23.0 21.7 20.4 19.4 (Continued on next slide) Vol 2, ESRD, Ch 1 23
Table 2.13 HP2020 CKD-13.1 Increase the proportion of patients receiving a kidney transplant within 3 years of end-stage renal disease (ESRD): Target 19.7% (Continued) 1998 (%) 1999 (%) 2000 (%) 2001 (%) 2002 (%) 2003 (%) 2004 (%) 2005 (%) 2006 (%) 2007 (%) 2008 (%) 2009 (%) 2010 (%) Sex Male Female Age <18 0-4 5-11 12-17 18-44 18-24 25-44 45-64 45-54 55-64 65+ 65-69 21.9 21.1 20.5 19.7 19.9 19.6 19.5 19.0 18.5 17.5 16.2 15.3 14.5 17.5 17.3 17.3 16.5 16.2 15.9 16.4 15.8 15.3 15.3 14.8 13.7 13.5 72.0 73.8 71.9 69.1 69.5 74.3 74.0 75.6 77.2 77.9 75.1 77.5 73.2 73.5 80.3 74.5 69.6 73.9 76.3 73.6 73.9 73.8 76.1 65.8 73.8 68.3 78.2 75.9 72.6 76.9 75.7 78.8 81.8 81.2 80.2 87.5 84.3 82.9 79.5 68.4 71.0 71.1 65.1 65.1 71.9 70.9 74.1 77.3 75.2 75.1 76.8 72.6 33.6 32.5 31.3 29.9 29.6 28.7 29.2 27.6 26.8 25.4 24.0 22.7 22.0 44.3 42.2 43.0 41.8 39.5 42.0 41.9 40.0 37.8 35.1 34.2 34.6 34.8 32.4 31.4 30.0 28.6 28.5 27.1 27.8 26.2 25.5 24.3 22.9 21.4 20.6 16.3 15.7 15.9 15.3 15.1 15.0 15.1 14.9 14.5 14.1 13.2 12.3 11.8 21.0 20.1 20.2 19.5 18.4 18.3 18.5 17.4 17.1 17.0 15.5 14.8 13.8 12.5 12.0 12.5 11.8 12.5 12.4 12.6 13.1 12.6 12.0 11.6 10.6 10.5 5.3 5.9 6.2 6.5 7.3 7.6 8.0 7.8 8.3 8.3 8.2 7.8 8.0 5.3 5.9 6.2 6.5 7.3 7.6 8.0 7.8 8.3 8.3 8.2 7.8 8.0 Data Source: Special analyses, Medicare 5 percent sample. Incident ESRD patients younger than 70. Abbreviations: CKD, chronic kidney disease; ESRD, end-stage renal disease. Vol 2, ESRD, Ch 1 24
Figure 2.2 HP2020 CKD-13.1 Geographic distribution of the adjusted proportion of patients receiving a kidney transplant within 3 years of end-stage renal disease (ESRD), by state, in the U.S. population, 2010: Target 19.7% Data Source: Special analyses, Medicare 5 percent sample. Incident ESRD patients younger than 70. Adjusted for age, sex, and race. Alaska and Hawaii are not reported due to small sample size. Abbreviations: CKD, chronic kidney disease. Vol 2, ESRD, Ch 1 25
Table 2.14 HP2020 CKD-13.2 Increase the proportion of patients who receive a preemptive transplant at the start of ESRD: No applicable target 2001 (%) 2002 (%) 2003 (%) 2004 (%) 2005 (%) 2006 (%) 2007 (%) 2008 (%) 2009 (%) 2010 (%) 2011 (%) 2012 (%) 2013 (%) All Race American Indian or Alaskan Native only Asian only Native Hawaiian or other Pacific Islander only Black or African American only White only Two or more races Ethnicity Hispanic or Latino Not Hispanic or Latino Black or African American only, not Hispanic or Latino White only, not Hispanic or Latino 3.3 3.3 3.4 3.7 3.9 4.1 4.1 4.0 3.8 3.9 4.0 3.7 3.7 * * 1.5 * * 1.4 * * 1.7 * 1.6 1.3 1.2 2.0 2.8 2.6 2.5 2.7 3.0 3.1 3.5 3.1 3.4 3.8 3.1 4.5 * * * * 1.0 * 1.9 2.6 2.0 * * * * 0.6 0.7 0.7 0.8 0.9 1.0 1.1 1.1 1.1 1.2 1.2 0.9 1.0 4.1 4.2 4.1 4.6 4.9 5.1 5.2 5.0 4.7 4.7 4.8 4.3 4.2 * * * * * * * * 1.4 1.5 1.5 1.8 1.9 2.3 2.3 2.2 2.2 2.2 2.4 2.2 2.2 3.2 3.3 3.3 3.6 3.8 3.9 4.1 3.9 3.7 3.8 3.8 3.4 3.5 0.6 0.7 0.7 0.8 0.9 1.0 1.1 1.1 1.1 1.2 1.2 0.9 1.0 4.8 4.9 4.8 5.4 5.7 6.0 6.3 6.0 5.5 5.6 5.7 5.1 4.9 (Continued on next slide) Vol 2, ESRD, Ch 1 26
Table 2.14 HP2020 CKD-13.2 Increase the proportion of patients who receive a preemptive transplant at the start of ESRD: No applicable target (Continued) 2001 (%) 2002 (%) 2003 (%) 2004 (%) 2005 (%) 2006 (%) 2007 (%) 2008 (%) 2009 (%) 2010 (%) 2011 (%) 2012 (%) 2013 (%) Sex Male Female Age <18 0-4 5-11 12-17 18-44 18-24 25-44 45-64 45-54 55-64 65+ 65-69 3.5 3.4 3.5 3.6 3.9 4.2 4.2 3.9 3.8 3.9 4.0 3.6 3.6 3.1 3.3 3.2 3.7 3.8 4.0 3.9 4.0 3.8 3.9 4.0 3.8 4.0 20.8 19.4 21.2 19.7 23.8 25.4 22.2 22.6 26.9 24.1 26.3 25.3 25.0 18.6 14.1 18.8 18.7 17.8 17.4 19.5 11.9 19.6 16.7 19.1 17.6 19.5 22.8 27.2 28.7 22.0 28.8 33.5 31.3 32.9 36.5 32.9 29.9 30.6 32.3 20.7 17.0 18.7 19.2 23.9 25.1 19.7 22.8 25.7 23.6 28.1 26.7 24.0 6.0 5.9 5.5 6.1 5.9 6.4 6.1 6.1 5.8 5.7 6.1 5.7 5.6 8.8 8.6 9.0 9.5 9.2 10.6 8.4 9.2 9.3 9.7 9.4 9.6 8.2 5.6 5.6 5.2 5.8 5.5 6.0 5.9 5.8 5.5 5.3 5.7 5.3 5.3 2.7 2.7 2.8 3.1 3.3 3.5 3.6 3.4 3.2 3.4 3.4 3.1 3.2 3.7 3.7 3.7 4.0 4.3 4.3 4.6 4.2 4.0 4.3 4.0 3.8 3.8 1.9 2.0 2.1 2.4 2.7 2.9 3.0 2.9 2.8 2.9 3.0 2.7 2.9 0.8 0.9 1.2 1.3 1.6 2.0 1.8 2.0 1.9 2.2 2.3 2.2 2.5 0.8 0.9 1.2 1.3 1.6 2.0 1.8 2.0 1.9 2.2 2.3 2.2 2.5 Data Source: Special analyses, Medicare 5 percent sample. Incident ESRD patients younger than 70. *Values for cells with 10 or fewer patients are suppressed. Abbreviations: CKD, chronic kidney disease; ESRD, end-stage renal disease. Vol 2, ESRD, Ch 1 27
Table 2.15 HP2020 CKD-14.1 Reduce the total number of deaths for persons on dialysis: Target 190.0 deaths per 1,000 patient years 2001 2002 2003 2004 2005 2006 2007 2008 2009 2010 2011 2012 2013 All Race American Indian or Alaskan Native only Asian only Native Hawaiian or other Pacific Islander only Black or African American only White only Two or more races Ethnicity Hispanic or Latino Not Hispanic or Latino Black or African American only, not Hispanic or Latino White only, not Hispanic or Latino 232.3 229.9 228.4 224.2 220.5 216.3 207.8 200.6 195.5 188.6 184.9 177.6 174.1 202.0 194.6 188.2 182.4 177.8 170.1 162.6 167.5 171.6 151.3 146.1 146.6 144.2 168.4 154.8 166.2 157.8 161.5 153.4 149.6 137.4 138.5 129.5 132.7 127.6 123.4 159.9 177.2 166.3 162.3 150.3 157.3 160.5 145.8 151.9 148.8 136.0 132.5 119.7 185.1 181.3 181.8 181.2 176.7 171.3 164.8 158.4 153.9 146.7 141.6 136.4 134.4 274.6 273.4 270.2 263.3 259.9 255.6 244.9 236.9 230.3 224.0 221.0 211.8 198.7 153.0 160.3 139.9 145.9 141.7 131.1 125.3 119.0 116.2 170.9 168.8 167.8 163.6 160.5 153.7 143.3 138.1 140.1 132.2 130.8 131.0 126.4 236.2 236.5 236.9 233.8 230.5 227.4 219.6 212.4 206.2 199.7 195.9 187.3 184.3 185.7 181.8 182.2 181.4 177.0 171.8 165.4 158.9 154.4 147.0 142.0 136.1 134.2 299.1 298.7 296.3 290.3 287.2 285.5 276.0 269.0 261.1 256.3 254.2 243.7 239.8 (Continued on next slide) Vol 2, ESRD, Ch 1 28
Table 2.15 HP2020 CKD-14.1 Reduce the total number of deaths for persons on dialysis: Target 190.0 deaths per 1,000 patient years (Continued) 2001 2002 2003 2004 2005 2006 2007 2008 2009 2010 2011 2012 2013 Sex Male Female Age <18 0-4 5-11 12-17 18-44 18-24 25-44 45-64 45-54 55-64 65+ 65-74 75-84 85+ 226.0 223.5 223.9 220.5 216.8 212.5 205.0 198.4 195.1 187.5 184.0 177.1 172.3 239.4 237.2 233.6 228.4 224.8 220.8 211.1 203.4 196.0 190.0 186.0 178.2 176.5 41.6 38.2 46.4 40.2 37.9 37.8 30.6 33.5 36.7 36.7 23.7 28.5 28.6 155.0 91.0 99.2 91.8 82.2 88.3 67.0 93.9 87.1 78.1 40.9 58.4 69.1 38.6 * 64.9 43.6 33.5 39.0 * 35.5 46.0 44.2 34.5 * * 16.7 34.4 28.3 27.8 29.4 25.3 21.6 15.6 17.6 20.2 13.4 16.1 * 88.7 90.2 87.6 84.0 82.5 79.8 75.8 71.2 70.1 63.9 61.5 59.4 58.1 48.7 45.6 51.8 52.3 49.1 49.7 47.1 44.1 40.1 37.5 36.8 32.6 33.3 92.1 93.9 90.6 86.6 85.3 82.3 78.2 73.4 72.6 66.0 63.5 61.6 60.0 174.9 169.9 171.5 167.8 161.6 160.2 152.1 145.7 142.2 136.3 133.3 127.8 123.3 145.6 139.7 138.9 137.1 133.6 131.2 126.0 117.8 114.7 108.0 106.3 98.9 96.8 199.8 195.2 198.3 192.5 183.4 182.4 171.7 166.3 162.0 156.2 151.8 147.3 140.8 349.0 345.6 339.7 334.3 332.0 324.1 313.3 304.0 295.0 285.9 280.5 268.0 263.0 287.8 284.0 278.3 272.3 268.5 257.1 246.6 240.4 235.7 226.6 220.9 212.1 210.1 404.2 395.4 386.8 381.5 377.9 371.5 357.8 346.6 333.0 323.0 317.7 302.2 296.4 562.5 567.4 547.3 527.3 524.8 515.1 508.9 485.2 464.4 455.3 449.8 433.5 423.3 Data Source: Special analyses, Medicare 5 percent sample. Period prevalent dialysis patients. *Values for cells with 10 or fewer patients are suppressed. Abbreviations: CKD, chronic kidney disease. Vol 2, ESRD, Ch 1 29
Table 2.16 HP2020 CKD-14.2 Reduce the number of deaths in dialysis patients within the first 3 months of initiation of renal replacement therapy: Target 328.7 deaths per 1,000 patient years at risk 2001 2002 2003 2004 2005 2006 2007 2008 2009 2010 2011 2012 2013 All Race American Indian or Alaskan Native only Asian only Native Hawaiian or other Pacific Islander only Black or African American only White only Two or more races Ethnicity Hispanic or Latino Not Hispanic or Latino Black or African American only, not Hispanic or Latino White only, not Hispanic or Latino 382.8 382.5 388.6 385.3 381.3 376.9 368.7 366.8 358.5 358.7 341.3 328.2 321.2 185.2 146.0 196.0 216.7 218.0 172.2 177.3 248.0 168.8 157.1 159.2 228.5 208.8 232.4 227.8 234.7 234.5 257.1 213.8 244.7 203.8 214.7 219.5 179.9 189.7 189.3 210.2 180.6 186.5 185.0 173.4 222.7 172.8 153.9 194.5 162.8 179.2 122.2 158.3 276.7 269.0 281.5 276.2 278.8 271.4 255.7 257.1 249.8 244.9 232.8 216.2 223.9 449.2 454.8 457.7 451.8 442.3 439.6 434.3 432.4 423.9 426.0 407.6 392.5 377.4 301.9 303.7 280.9 295.6 209.6 262.1 260.4 247.2 237.9 247.1 227.4 243.6 229.6 242.0 219.6 220.8 212.9 207.3 209.7 205.3 198.7 188.7 400.0 403.7 407.7 405.9 399.5 397.7 389.9 387.9 379.9 381.4 363.5 347.3 341.9 277.6 268.8 281.9 277.3 278.6 271.7 257.5 257.9 250.4 245.8 234.4 214.8 224.2 484.5 498.0 498.4 495.1 484.1 489.9 483.4 486.2 478.0 482.1 462.9 444.6 427.3 (Continued on next slide) Vol 2, ESRD, Ch 1 30
Table 2.16 HP2020 CKD-14.2 Reduce the number of deaths in dialysis patients within the first 3 months of initiation of renal replacement therapy: Target 328.7 deaths per 1,000 patient years at risk (Continued) 2001 2002 2003 2004 2005 2006 2007 2008 2009 2010 2011 2012 2013 Sex Male Female Age <18 0-4 5-11 12-17 18-44 18-24 25-44 45-64 45-54 55-64 65+ 65-74 75-84 85+ 384.3 377.0 387.8 385.4 375.8 373.0 370.5 368.9 363.7 356.2 340.1 323.6 319.8 381.2 389.1 389.6 385.3 388.2 381.8 366.5 364.1 351.9 361.9 342.9 334.3 323.1 * * * 59.3 * * * . * * * * * * * * . * . * * * . * * * * * * * * * * * * * * * * * * * * * * . * * * * * * 102.0 104.3 106.1 107.5 107.5 105.8 101.4 101.8 108.3 94.8 94.8 76.1 82.2 72.5 54.5 63.1 76.1 65.4 93.7 69.9 59.7 45.6 68.0 62.2 * 52.1 105.1 109.7 110.7 110.7 111.9 107.1 104.8 106.2 114.5 97.5 98.3 81.1 85.3 219.3 215.1 224.4 217.4 221.1 214.3 205.4 214.9 210.2 213.7 200.7 193.3 192.5 162.4 168.3 171.6 172.9 177.7 163.4 160.3 175.3 161.7 167.0 158.6 144.3 143.8 261.5 250.1 263.6 249.6 251.6 250.4 236.2 241.3 242.1 243.3 227.6 223.3 222.9 590.7 588.8 596.4 595.7 587.5 585.9 579.6 566.9 552.2 548.7 526.9 512.0 493.0 443.9 443.4 430.2 436.6 432.4 419.8 415.7 418.5 408.4 403.5 381.3 380.5 366.7 694.6 687.9 698.9 692.8 673.0 681.3 671.7 633.3 628.0 636.2 609.6 588.2 569.0 1054.8 990.0 1070.9 1022.3 1008.7 1018.8 987.0 993.2 927.6 901.0 902.8 873.4 871.7 Data Source: Special analyses, Medicare 5 percent sample. Incident dialysis patients, unadjusted. . Zero values in this cell; *Values for cells with 10 or fewer patients are suppressed. Abbreviations: CKD, chronic kidney disease. Vol 2, ESRD, Ch 1 31
Table 2.17 HP2020 CKD-14.3 Reduce the number of cardiovascular deaths for persons on dialysis: Target 80.9 deaths per 1,000 patient years at risk 2001 2002 2003 2004 2005 2006 2007 2008 2009 2010 2011 2012 2013 All Race American Indian or Alaskan Native only Asian only Native Hawaiian or other Pacific Islander only Black or African American only White only Two or more races Ethnicity Hispanic or Latino Not Hispanic or Latino Black or African American only, not Hispanic or Latino White only, not Hispanic or Latino 117.6 114.2 111.6 106.8 100.6 94.5 89.2 84.5 81.7 79.0 75.7 73.5 70.6 102.8 91.8 88.9 84.2 76.4 72.5 68.3 60.7 68.7 62.1 57.8 57.0 55.0 94.6 84.8 91.3 81.6 83.1 69.4 67.8 65.1 65.9 59.8 60.8 57.6 55.6 99.7 110.5 102.1 88.0 76.4 86.2 80.4 72.0 79.8 79.3 66.4 65.3 61.9 90.3 88.2 86.5 84.9 81.0 76.9 72.0 69.2 66.4 62.9 59.5 59.0 56.8 140.4 136.2 132.6 125.9 117.7 109.8 103.7 97.4 94.0 91.9 88.8 85.4 81.9 69.5 71.7 63.7 67.4 61.7 64.4 57.1 49.4 47.2 91.0 87.5 83.7 80.7 77.8 70.9 65.2 62.9 64.4 60.9 59.1 59.0 57.6 119.1 116.9 115.5 110.9 104.4 98.8 93.6 88.6 85.2 82.6 79.2 76.6 73.4 90.6 88.3 86.8 85.0 81.0 77.0 72.3 69.3 66.5 63.1 59.6 58.9 56.7 152.2 148.1 145.2 138.1 128.6 121.1 115.5 108.6 104.0 102.7 99.5 95.7 91.4 (Continued on next slide) Vol 2, ESRD, Ch 1 32
Table 2.17 HP2020 CKD-14.3 Reduce the number of cardiovascular deaths for persons on dialysis: Target 80.9 deaths per 1,000 patient years at risk (Continued) 2001 2002 2003 2004 2005 2006 2007 2008 2009 2010 2011 2012 2013 Sex Male Female Age <18 0-4 5-11 12-17 18-44 18-24 25-44 45-64 45-54 55-64 65+ 65-74 75-84 85+ 116.9 113.6 111.9 107.7 101.3 95.6 90.2 86.2 83.9 80.8 77.5 75.5 72.2 118.4 114.9 111.3 105.7 99.8 93.3 88.0 82.4 79.0 76.7 73.5 70.8 68.4 14.1 11.9 9.1 13.0 15.5 16.6 * 9.4 15.9 8.5 * 9.7 * * * * * * * * * 45.4 * * * * * * * * * * * * * * * . * * 11.8 * * 15.7 13.7 * * * * * * * 40.1 40.6 39.0 38.0 37.2 34.9 32.3 30.5 30.6 28.9 26.6 26.9 25.9 19.9 19.3 24.3 24.2 23.6 18.7 18.1 16.1 17.9 18.5 17.9 13.2 14.1 41.8 42.4 40.3 39.1 38.3 36.3 33.5 31.7 31.7 29.7 27.3 27.9 26.9 88.9 85.7 83.9 80.4 75.3 72.8 67.8 64.7 63.0 60.4 58.4 56.9 54.7 72.3 68.9 66.0 63.6 60.7 59.2 56.3 52.7 51.4 47.2 47.6 44.8 43.4 103.1 99.8 98.6 94.0 86.6 83.3 76.5 73.6 71.5 69.7 65.8 65.1 62.1 178.5 172.3 167.6 159.6 150.1 138.9 132.1 124.5 119.2 115.6 110.6 106.1 101.2 149.5 143.0 138.3 132.6 123.9 114.0 107.4 103.4 100.2 95.7 92.1 88.8 85.7 205.0 195.7 190.4 179.9 170.1 155.6 149.6 137.9 130.0 128.4 122.1 115.6 111.5 277.5 278.8 265.6 244.6 225.4 214.3 199.6 187.2 178.6 171.8 163.1 161.0 146.5 Data Source: Special analyses, Medicare 5 percent sample. Period prevalent dialysis patients; unadjusted. *Values for cells with 10 or fewer patients are suppressed. Abbreviations: CKD, chronic kidney disease. Vol 2, ESRD, Ch 1 33
Table 2.18 HP2020 CKD-14.4 Reduce the total number of deaths for persons with a functioning kidney transplant: Target 29.3 deaths per 1,000 patient years at risk 2001 2002 2003 2004 2005 2006 2007 2008 2009 2010 2011 2012 2013 All Race American Indian or Alaskan Native only Asian only Native Hawaiian or other Pacific Islander only Black or African American only White only Two or more races Ethnicity Hispanic or Latino Not Hispanic or Latino Black or African American only, not Hispanic or Latino White only, not Hispanic or Latino 34.2 32.2 33.4 32.0 32.5 31.9 31.5 30.3 31.7 31.7 31.8 31.9 31.8 40.5 36.6 42.1 41.1 40.8 45.0 37.8 38.7 57.0 48.3 44.4 43.5 36.6 21.5 21.2 18.3 20.5 22.6 19.3 24.0 19.4 16.7 17.4 22.0 22.9 18.8 * 25.2 * 19.2 24.7 17.3 13.2 17.0 25.0 17.7 18.2 20.3 26.0 38.6 36.3 37.6 34.0 34.7 34.1 30.5 31.2 30.8 30.5 31.3 30.7 30.4 34.0 32.0 33.4 32.3 32.7 32.2 32.5 30.8 32.7 32.9 32.7 32.9 33.0 22.7 20.6 15.6 24.0 23.8 23.4 24.7 27.1 32.2 22.3 20.8 19.3 18.8 22.6 23.3 20.9 21.6 23.6 23.7 23.6 23.5 25.1 30.0 28.9 31.9 30.6 30.8 30.3 30.9 29.7 31.1 31.7 32.4 33.2 33.0 39.1 36.7 37.9 34.3 35.1 34.5 30.7 31.6 30.7 30.7 31.4 31.0 30.3 35.3 33.3 35.2 34.2 34.1 33.4 34.3 32.3 34.4 34.5 34.5 34.8 34.9 (Continued on next slide) Vol 2, ESRD, Ch 1 34
Table 2.18 HP2020 CKD-14.4 Reduce the total number of deaths for persons with a functioning kidney transplant: Target 29.3 deaths per 1,000 patient years at risk (Continued) 2001 2002 2003 2004 2005 2006 2007 2008 2009 2010 2011 2012 2013 Sex Male Female Age <18 0-4 5-11 12-17 18-44 18-24 25-44 45-64 45-54 55-64 65+ 65-74 75-84 85+ 36.5 33.9 34.6 34.2 35.0 33.8 33.5 32.0 33.2 33.8 34.1 34.0 33.6 30.8 29.8 31.7 28.9 29.0 29.2 28.4 27.8 29.5 28.6 28.5 29.0 29.2 4.8 8.5 6.7 3.6 7.6 4.7 * * 3.0 6.3 2.9 2.6 * * * * * * * * * * * * * * * * * * * * * * * * * * * * 7.3 6.6 * 8.6 5.0 * * * 6.2 * * * 15.4 14.4 12.7 12.5 12.2 11.7 10.9 10.0 10.1 9.2 8.5 8.1 7.6 9.7 5.2 5.6 7.0 7.3 8.2 6.7 6.4 6.3 6.1 4.2 5.5 5.1 16.0 15.4 13.4 13.1 12.8 12.1 11.4 10.4 10.5 9.5 9.0 8.5 7.9 39.7 35.6 36.6 33.3 33.7 32.3 30.3 28.9 28.8 28.1 28.1 25.9 25.6 30.8 28.3 27.4 24.7 25.6 24.9 22.2 21.9 22.4 19.8 19.1 16.6 16.9 52.3 45.5 48.3 43.7 43.0 40.4 38.8 36.0 35.1 35.9 36.2 34.0 33.2 91.7 85.9 91.0 87.1 83.6 79.8 80.0 73.3 77.0 75.4 74.2 76.7 73.4 85.9 80.5 82.2 78.9 76.4 70.5 71.3 63.8 66.9 65.7 63.4 64.7 61.2 137.7 126.5 153.2 138.0 124.2 130.3 122.0 117.0 121.3 113.6 115.3 120.0 117.3 * * * * 182.9 134.9 211.2 146.8 152.4 196.1 169.4 225.2 192.3 Data Source: Special analyses, Medicare 5 percent sample. Period prevalent transplant patients, unadjusted. *Values for cells with 10 or fewer patients are suppressed. Abbreviations: CKD, chronic kidney disease. Vol 2, ESRD, Ch 1 35
Table 2.19 HP2020 CKD-14.5 Reduce the number of cardiovascular deaths in persons with a functioning kidney transplant: Target 4.5 deaths per 1,000 patient years at risk 2001 2002 2003 2004 2005 2006 2007 2008 2009 2010 2011 2012 2013 All Race American Indian or Alaskan Native only Asian only Native Hawaiian or other Pacific Islander only Black or African American only White only Two or more races Ethnicity Hispanic or Latino Not Hispanic or Latino Black or African American only, not Hispanic or Latino White only, not Hispanic or Latino 5.9 5.3 5.4 5.8 5.7 5.4 5.3 4.3 4.4 4.4 3.7 3.5 3.0 * 9.4 * * * * * * * * * * * * 3.6 * 2.6 3.1 3.7 3.6 1.9 * 1.8 2.1 2.4 * * * * * * * * * * * . * * 7.2 6.3 6.5 6.3 6.1 6.2 5.5 5.1 5.2 5.0 4.4 4.0 3.4 5.7 5.1 5.4 5.9 5.7 5.3 5.4 4.2 4.3 4.4 3.7 3.5 2.9 * 4.8 * * 4.1 * * * 4.0 3.7 4.5 3.4 3.5 3.9 4.1 3.3 3.4 3.5 3.0 3.3 2.3 2.3 5.7 5.2 5.6 5.6 5.6 5.3 5.3 4.3 4.4 4.7 3.8 3.8 3.2 7.4 6.3 6.6 6.4 6.2 6.3 5.6 5.2 5.2 4.9 4.3 4.0 3.4 6.0 5.2 5.6 6.3 5.9 5.4 5.7 4.3 4.5 4.7 3.7 3.7 3.1 (Continued on next slide) Vol 2, ESRD, Ch 1 36
Table 2.19 HP2020 CKD-14.5 Reduce the number of cardiovascular deaths in persons with a functioning kidney transplant: Target 4.5 deaths per 1,000 patient years at risk (Continued) 2001 2002 2003 2004 2005 2006 2007 2008 2009 2010 2011 2012 2013 Sex Male Female Age <18 0-4 5-11 12-17 18-44 18-24 25-44 45-64 45-54 55-64 65+ 65-74 75-84 85+ 6.4 5.8 5.7 6.5 6.1 5.7 6.0 4.8 4.4 4.9 4.1 3.6 3.3 5.1 4.7 5.0 4.9 5.1 4.9 4.2 3.6 4.3 3.7 3.0 3.3 2.5 * * * . * * * * . * . * . * * . . . . * . . * . . . * . * . . . . . . . . . . * * * . * * * * . * . * . 2.6 2.7 2.4 2.5 2.4 2.1 2.1 1.8 1.4 1.3 1.0 1.2 1.2 * * * * * * * * * * * * * 2.8 2.9 2.5 2.7 2.5 2.2 2.2 1.9 1.5 1.4 1.0 1.2 1.3 7.1 6.0 6.1 6.4 5.9 5.8 5.3 4.3 4.1 4.2 3.5 2.9 2.6 6.6 4.5 5.0 5.4 4.6 4.4 4.4 3.4 3.4 2.9 2.3 2.0 1.9 7.8 7.9 7.5 7.6 7.4 7.3 6.2 5.2 4.8 5.5 4.6 3.7 3.2 13.9 12.9 13.2 14.1 13.9 12.1 12.2 8.9 10.2 9.6 8.0 7.8 5.9 13.7 11.6 11.7 13.3 13.4 10.4 10.9 8.3 8.9 8.9 7.6 6.7 5.4 15.1 22.5 24.2 19.4 16.2 22.0 18.4 11.9 16.5 12.2 9.1 12.3 8.1 * * . * * . * * * * * * * Data Source: Special analyses, Medicare 5 percent sample. Period prevalent transplant patients, unadjusted. . Zero values in this cell; *Values for cells with 10 or fewer patients are suppressed. Abbreviations: CKD, chronic kidney disease. Vol 2, ESRD, Ch 1 37