Methods for Sampling to Address Bias in Statistical Analysis
Learn about different sampling methods to ensure randomness and address bias in statistical analysis, including random samples, sources of bias, and procedures for creating unbiased samples from various distributions like uniform and normal. Understand primary and secondary data, population vs. sample, and forming random samples to make informed statistical decisions.

Download Presentation

Please find below an Image/Link to download the presentation.
The content on the website is provided AS IS for your information and personal use only. It may not be sold, licensed, or shared on other websites without obtaining consent from the author. If you encounter any issues during the download, it is possible that the publisher has removed the file from their server.
You are allowed to download the files provided on this website for personal or commercial use, subject to the condition that they are used lawfully. All files are the property of their respective owners.
The content on the website is provided AS IS for your information and personal use only. It may not be sold, licensed, or shared on other websites without obtaining consent from the author.
E N D
Presentation Transcript
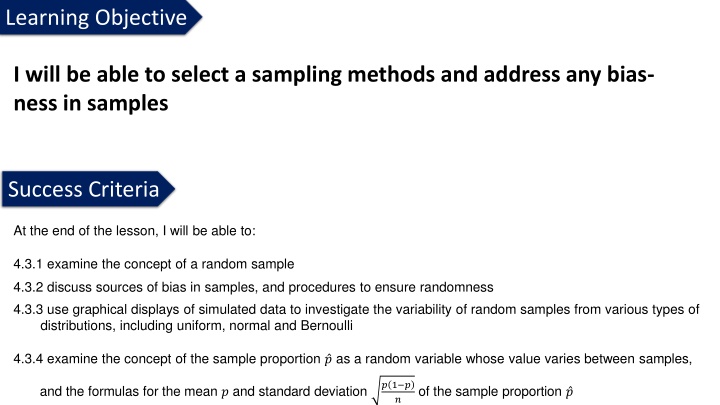
Learning Objective I will be able to select a sampling methods and address any bias- ness in samples Success Criteria At the end of the lesson, I will be able to: 4.3.1examine the concept of a random sample 4.3.2discuss sources of bias in samples, and procedures to ensure randomness 4.3.3 use graphical displays of simulated data to investigate the variability of random samples from various types of distributions, including uniform, normal and Bernoulli 4.3.4 examine the concept of the sample proportion ? as a random variable whose value varies between samples, ? 1 ? ? and the formulas for the mean ? and standard deviation of the sample proportion ?
Vocabulary Primary Data: Data which is collected by the organisation that is going to use for statistical analysis. It may be collected by: o Direct observation o Interviews o Questionnaires o Surveys Secondary Data: Data which is obtained by some external sources such as: o Newspapers o Internet o Television o Agencies such as the Australian Bureau of Statistics o Secondary data is easy to acquire and process is not as expensive but data may have been refined, and its originality may be lost.
Samples and Population Census: Involves the entire population to be considered. Population: The set of all eligible members of a group which we intend to study Example: If we are interested in the Methods sores of the Year 12 students in the whole of Western Australia. This group of students could be considered a population. Sample: Since the entire population is too big to study, we obtain a sample from the population instead. A sample is a subset of the entire population. Example: If we choose to look at the scores of Year 12 students from 3-4 schools Random sample is a subset of the entire population that has been formed in such a way that every member from the population has a non-zero probability of being selected for the sample. We will look at a number of ways we can look at obtaining a random sample such as if it is a simple random sample, then all members have an equal chance of being selected.
Forming a Random Sample Simple random samples o At the start of the process, every member from the population will be allocated a unique number and the number is then randomly drawn. In this case, every member has an equal chance of being chosen o Disadvantage: We could end up with a sample such that the sample may consist predominantly of the same gender or age group. In which, this sample would no longer be a good representative of the population Systematic or interval o Similar to above, at the start of the process, every member from the population will be allocated a unique number and a number is selected at every interval between them. Eg. selecting every 5th number. o Disadvantage: Only at the start of the sampling process with the first selection be random. Once the first number is chosen, the other numbers forming the sample are automatically selected hence those outside the interval have no longer any chance of being selected. Stratified samples o Population is first divided into layers such as homogeneous groups. Then either using simple random sampling or systematic sampling to select the sample by taking samples within the layers. o Disadvantage: Not all members of the population have an equal chance of being selected. Constructing stratified samples can be both time consuming, labour intensive and expensive. Cluster samples o Population is divided into subgroups or clusters and a set of these clusters will be selected to be the sample. o Disadvantage: All members of the selected cluster are selected but those outside the selected clusters will not be selected
Random Sampling To ensure a sample is random, such that all members of the population have an equal chance of being selected, we: 1) Assign a number to every member of the population. If we are not dealing with people, but maybe an area, we can divide the total area into equal regions and assign a number to each region. 2) Use random number generators or the name in a hat to choose the members of our sample. Another important factor for a random sample to be an appropriate reflection of the population is the sample size, n. In general, if n gets larger, then we are ensuring the accuracy of our results such that it will reflect the characteristics of the population better.
Random Sampling To generate a random sample, here is what we can do. Supposing the population has 100 people in it and we wanted a sample of 30 people, we could then use a random number generator to generate the sample of 30 without bias. Under the Catalog tab, if you go to the R tab you should find the rand() function. Without parameters it will randomly generate a number between 0 and 1 for you. If parameters are set to generate numbers between 1 to 100 (inclusive) then it will generate integer values within that specified range. If you want to immediately have 30 numbers generated, using randList() is preferred. The first value is the sample, the next two values are the boundaries.
Systematic Sampling A random sample can also be selected through a systematic approach, such as lining up everyone in alphabetical order and choosing every 3rd person for the sample. The only issue with this is: imagine we were sampling components from a machine and every 20th component was faulty (20th, 40th, 60th, ). If we started selecting our sample from the 17th component, and then chose every 25th component from there, notice that no defectives would be included in our sample (17, 42, 67, 92, ). Cluster Sampling The population is divided into subgroups or clusters and a set of these clusters will be selected to be the sample. Example: A well-known fast food chain has 540 stores nationwide and management wishes to survey its customers about a possible new menu. The management of the fast food chain might randomly select 80 of their stores and conduct a survey using probability sampling methods
Stratified Sampling In stratified sampling, the sample is randomly selected in layers. It allows us to obtain a sample that not only represents the entire population but also the subgroups within the population. Example: If a sample of 60 students is required from the 1221 students attending a particular High School which has 6 year levels. Then the 6 year levels are the layers, and we will select 10 students from each year level using random selection. This is known as non-proportional stratified sampling. This method does not take into consideration the size of each layer and hence is not a true representative of the population. Proportional Stratified Sampling Here, the size of each layer is taking into consideration and a sample is selected based on the proportion to the size. Suppose the 1221 students distributed as follows: 221 students in Year 7 285 students in Year 10 124 students n Year 11 103 students in Year 12 240 students in Year 8 248 students in Year 9 If we wanted to select a sample of 60 students, we could calculate the proportions of each layer as follows: 221 1221 60 10.9 240 1221 60 11.8 248 1221 60 12.2 (11 Year 7s) (12 Year 8s) (12 Year 9s) 285 1221 60 14.0 Hence our sample of 60 students would consist of these proportions of students from each year group. 124 1221 60 6.1 103 1221 60 5.1 (14 Year 10s) (6 Year 11s) (5 Year 12s)
More Sampling Methods Convenience samples o Members of convenience sample are chosen because they are readily available o Example: If a sample of 200 students is required then a possible convenience sample would be to head to a high school where the researcher lives and select the first 200 students in that high school o Advantage: Cost and time effective o Disadvantage: Sample is usually bias Quota samples o Similar to Stratified sampling where population is divided into layers However, instead of a random sampling method involve in selecting the sample in a given layer, a method of convenience sampling is used. o Eg if a sample of 60 students are required from 1221 high school students, then 10 students from each year group are selected using convenience sampling such as the first 10 of each layer to arrive at the high school in the morning. This will form some bias-ness as students arriving later than the 10 students will have no chance of being included in the sample. Self-selection/Volunteer samples Members of the population volunteer themselves rather than being selected. E.g.: If 200 students are required, if a mass email is being sent out, the first 200 students to respond positively to the email will form the sample. This sampling method usually requires one to send out a mass email, or complete phone-in surveys used by radio or television stations or surveys sent out in newspaper. Disadvantage: Can be open to abuse as no limit to the number of times a person can complete the survey. Bias-ness towards people with a stronger opinion in the survey are more likely to complete the survey than one who is not.
Guided Practice For each of the scenarios, match the most appropriate sampling method chosen from the following, given a reason of your choice. Methods: Volunteer sampling, Quota sampling, Cluster Sampling, Stratified Sampling, Simple Random Sampling, Systematic Sampling, Convenience Sampling a) A restaurant owner wants feedback on how their customer service is so he leaves a survey card on each table. The principal of a large secondary school college wants to find out what students think of the Year 8 mathematics curriculum. He selects three of the eleven Year 8 Mathematics classes and surveys all of the students in those classes. Volunteer sampling Customers choose to or choose not to complete the survey card b) a) b) Cluster sampling Three classes chosen, all students surveyed.
Guided Practice For each of the scenarios, match the most appropriate sampling method chosen from the following, given a reason of your choice. Methods: Volunteer sampling, Quota sampling, Cluster Sampling, Stratified Sampling, Simple Random Sampling, Systematic Sampling, Convenience Sampling a) A football club wants to survey its fans regarding a new promotion. The promotion team decides to survey 250 fans by using the same proportions of age groups as the population b) A university student of a residential college is working on a survey of student s attitudes towards college administrators, and so he talks to his roommates and other people on the floor of its residential college. a) Surveys in same proportion Stratified sampling b) Convenience sampling Sample made up of people within easy reac.
Guided Practice Avonlorne Secondary College has an enrolment of 424 Year 8 students, 352 Year 9 students, 296 Year 10 students, 284 Year 11 students and 207 Year 12 students. How many students from each year group must be taken to make up a sample of 100 students which reflects the proportion of students in each year group? Total number of students: 424 + 352 + 296 + 284 + 207 = 1563 424 1563 100 = 27.1273 27 Proportion for Year 8: 352 1563 100 = 22.521 23 Proportion for Year 9: 296 1563 100 = 18.9379 19 Proportion for Year 10: 284 1563 100 = 18.1702 18 Proportion for Year 11: 207 1563 100 = 13.244 13 Proportion for Year 12:
Bias-ness When a sample has not been formed by random selection, or if the sample is not large enough, it is more likely to introduce bias. Bias, in the context of sampling in Mathematics, is when a sample statistic over or under- estimates the population parameter. A sample is deemed bias if members of the population from which the sample is derived either has: Zero chance of being selected Probability of these members being selected cannot be determined before hand Most samples are biased to a certain degree and it is almost impossible to design and conduct a bias-free sample. There are two main source of bias Sampling bias (aka selection bias) Response bias
Selection Bias Selection bias occurs when some members of the population are less likely to be included in the sample than others Under-coverage bias Occurs when some members of the population are under-represented or over-represented. This is usually a problem in convenience samples. Voluntary Response or Self-selection bias Occurs when sample consists of people who volunteer to respond because they have strong opinions on the issue. As such, over-represent individual who have a strong opinions Self-interest bias or self-serving bias Occurs when researchers have an interest in the outcome, hence judgements are shaded by their own interest Non-response bias When chosen individuals for the sample are unwilling or unable to participate. Hence the sample is no longer a representative of the population
Response Bias Response bias occurs when participants give inaccurate response for any reason. Eg. Participants in a survey deliberately give false or misleading answer. Leading question bias Occurs when the wording of the question prompts the respondent to answer in a particular way Eg. How was the car going when it smashed into the bus? Implies that the car was at fault and suggests that the car was travelling at a high speed. How can we reword this question? How fast was each vehicle travelling when the accident occurred? - Does not assign any blame or pre- judgement. Social desirability bias Respondents answer questions in a manner that will be view favourably by others instead of choosing response that are reflective of their true feelings. This becomes an issue when it involves socially sensitive topics like religion, politics, drug use, race, cheating etc Acquiescence bias Respondents to a survey have a tendency to agree with all the questions
Reducing Bias Select participants from the target population randomly such as using stratified random sampling. Have a large sample size. The more participants you take in your sample, the more information you will have and the better your estimates will be Note: If your sampling method is flawed, then increasing the sample size will not reduce bias- ness.
Guided Practice In order to determine the sort of film in which to invest his money, a producer waits outside a theatre and asks people as they leave whether they prefer comedy, drama, horror or science fiction. Do you think this is an appropriate way of selecting a random sample of movie goers? Explain your answer. No, the sample will be biased towards the type of movie being shown. In order to survey the attitude of parents to the current uniform requirements, the principal of a school selected 100 students at random from the school roll, and then interviewed their parents. Do you think this group of parents would form a simple random sample? No, a parent s chance of selection depends on how many children they have at the school.
Guided Practice A pharmaceutical company wishes to gather information on a new form of headache tablets. Comment on whether there is any bias in the following sampling methods, giving reasons for your answers. a) Biased, as dental patients are more likely to have headaches due to dental pain on average. b) People waiting at a central bus station in the city were selected. People were surveyed outside a dental clinic. No bias, as there is no connection between headaches and mode of travel in general. IF there was bias, it would only be in that not all people take public transportation and so not every member of the population would have equal contribution to the survey. c) People were contacted using random mobile numbers. Biased, as not every person in the population has access to a mobile phone. Some may only use landlines.
Guided Practice 1) On a particular media website, readers were invited to respond to the following question: Do you agree that asylum seeker boats should be forcefully turned away from Australian territorial waters? Comment on this method of sampling public opinion on the matter and discuss possible sources of bias. 2) On a popular celebrity cooking show, viewers were invited to SMS their choice of one of two celebrities for the title of Australia s favourite celebrity chef . Comment on this method of polling for the title and discuss the possible sources of bias. 3) An expensive private school (single sex) conducted a phone poll on the families of 200 of its students to gauge the proportion of families supporting the extending of school hours for the students. Comment on the choice of sampling and discuss possible sources of bias and ways to reduce them.
Guided Practice On a particular media website, readers were invited to respond to the following question: Do you agree that asylum seeker boats should be forcefully turned away from Australian territorial waters? Comment on this method of sampling public opinion on the matter and discuss possible sources of bias. This is an example of self-selection/voluntary response sampling and hence, it is not random. Subsequently, one possible source of bias is non-response bias (not every reader will participate in the survey if they can choose to participate). Not all of the Australian population would use this particular website, and hence individuals who do not have internet access, or who may not understand English, are neglected from the sample.
Guided Practice On a popular celebrity cooking show, viewers were invited to SMS their choice of one of two celebrities for the title of Australia s favourite celebrity chef . Comment on this method of polling for the title and discuss the possible sources of bias. This is another example of self-selection/voluntary response sampling and again, it is not random. The results will be distorted due to more responses from interested groups, and no responses from viewers who do not want to participate in the poll. Additionally, not all individuals may have access to a mobile phone to participate in the poll.
Guided Practice An expensive private school (single sex) conducted a phone poll on the families of 200 of its students to gauge the proportion of families supporting the extending of school hours for the students. Comment on the choice of sampling and discuss possible sources of bias and ways to reduce them. This is an example of convenience sampling, as the school is calling their students parents for an opinion so it is easy and efficient. However, the timing at which the calls are made will cause possible sources of bias as working parents may not be able to be contacted. If they are, their opinions may be distorted if they are interrupted during their working hours (i.e. under stress etc.). Furthermore, not all parents are English-speaking and if the poll is done in English, this would cause distorted results. To reduce this bias, the school should consider categories of parents to ensure they provide equal opportunities for working parents and stay-at-home parents to response to the poll.
Sample Proportion Population proportion - denoted as ?. To determine the population proportion ? with a certain attribute: ? =no.of population with attribute population size ? Population Standard deviation Sample proportion - denoted as ?. To determine the sample proportion ? with a certain attribute: ? =no.of ?????? with attribute ?????? size ? Population Standard deviation
Guided Practice In a certain school, 35% of the students travel on the school bus. A group of 100 students were selected in a random sample, and 42 of them travel on the school bus. In this example: a) What is defined to be the population? b) What is the value if the population proportion? c) What is the value of the sample proportion? The population is all students in this school ? = 0.35 ? = 0.42
Estimation Guided Practice To estimate the number of marron in his dam, a famer caught 38 marron marked them and then released them back into the dam. After a few days, the farmer took a second sample of 53 marron from the dam and found amongst them three marked marron. Based on these figures, estimate the number of marron in this dam at this time. Consider the number of marked marron to population size, 38 Proportion of marked marron = ????? ?????? ?? ??????? Consider the recaptured marked proportion 3 53 Proportion of marked marron from recaptured sample = To estimate the number of total marrons, we approximate: No.of total marked marrons Popoluation size No of sample marked marrons Sample size 38 3 53 ??????????? ???? ?????????? ???? 53 3 38 = 671 ???????
Estimation Guided Practice 5000 fingerlings (young fish) were released into a tank and a sample of fingerlings was taken from this tank and sexed. It was found that 307 of the fingerlings were female and 38 were male. Estimate the number of male fingerlings in the tank. Consider the sample proportion of male, 38 38 345 Male proportion= 307+38= To estimate the number of male, we approximate: No.of male Popoluation size no of male in sample Sample size ??.?? ???? 5000 38 345 38 345 5000 = 500 male spieces ?? ?? ????
Variability of Samples The first row of graphs show the distributions of a sample of 20 numbers generated from a random variable, X, with distributed across the integers 1 to 8. X uniformly Theoretically, we expect the chances of each value to be equally likely (since it is uniform), and we also expect the shape of the distribution to be rectangular. We also expect the mean to be 4.5. However, it makes sense that different samples (taken by experimentation) will show variations.
Variability of Samples (Food for thought) The first row of graphs show the distributions of a sample of 20 numbers generated from a random variable, X, with ?~?(6,1.22). The next two rows increase the sample size. Are all samples of the same size, and same type of distribution, identical? Are the means of the samples close to the population mean (i.e. note the mean is 6)? Do they get closer to this value as we increase the sample size? Are the standard deviations of the samples close to the population standard deviation (i.e. note the S.D. is 1.2)? Do they get closer to this value as we increase the sample size? Does the shape of the distribution become closer to what we expect theoretically as the sample size increases?
Guided Practice Consider the following samples of size 40 obtained from a Bernoulli distribution with ? = 0.6. Sample A Sample B ? 0 1 0 1 ? 12 28 18 22 ? = 0.6 Theoretically, what is the mean of this sample size? Calculate the mean of each sample: =28 40= 0.7 a) ?? c) ?? b) ?? d) ?? Compare the given samples Sample A has a higher mean but sample B has a larger spread
Independent Practice Complete Jklup Ex 5A 5D Cambridge Ex 12A


")