Montana Dual Enrollment Statistics 2014-2019
Data on Montana dual enrollment students from 2014-2019, including student counts, public schools enrollment, graduation rates for bachelor's and associate's degrees within specific time frames, and comparison between all MUS students and dual enrollment MUS students.

Download Presentation

Please find below an Image/Link to download the presentation.
The content on the website is provided AS IS for your information and personal use only. It may not be sold, licensed, or shared on other websites without obtaining consent from the author.If you encounter any issues during the download, it is possible that the publisher has removed the file from their server.
You are allowed to download the files provided on this website for personal or commercial use, subject to the condition that they are used lawfully. All files are the property of their respective owners.
The content on the website is provided AS IS for your information and personal use only. It may not be sold, licensed, or shared on other websites without obtaining consent from the author.
E N D
Presentation Transcript
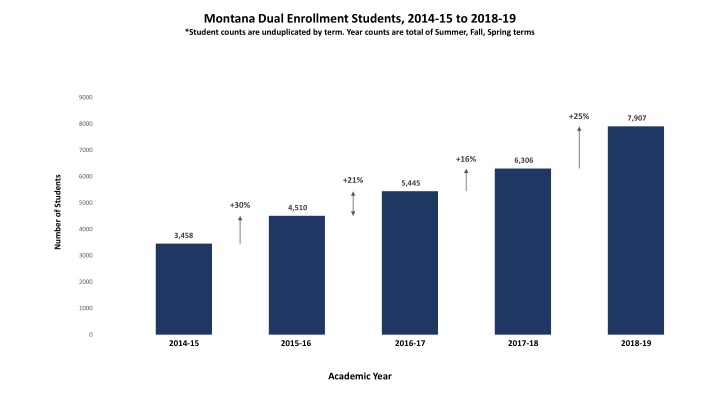
Montana Dual Enrollment Students, 2014-15 to 2018-19 *Student counts are unduplicated by term. Year counts are total of Summer, Fall, Spring terms 9000 +25% 7,907 8000 7000 +16% 6,306 6000 Number of Students +21% 5,445 5000 +30% 4,510 4000 3,458 3000 2000 1000 0 2014-15 2015-16 2016-17 2017-18 2018-19 Academic Year
2014 2014- -15 & 2018 15 & 2018- -19 19 Montana Public Schools with students enrolled in Dual Enrollment by MHSA Class Size, 2014-15 & 2018-19 100 +35% 93 90 80 69 70 Number of Public Schools 60 50 40 +30% 35 27 30 20 10 0 2018-19 2014-15 2018-19 2014-15 Class AA & A Class B & C
Percent of MUS Students Graduating with a Bachelors Degree within Four Years, All MUS Students vs. Dual Enrollment MUS Students, by Cohort Year *MUS Cohort consists of first-time, full-time, bachelor s degree seeking students *Dual Enrollment Cohort consists of first-time, full-time, bachelor s degree seeking students who enrolled in dual enrollment at a MUS college 50% 45% 43% Percent Graduated from Bachelor's Degree Program within Four Years 39% 40% 35% 35% 33% 30% 30% 28% 26% 25% 23% 20% 15% 10% 5% 0% 2012-13 COHORT 2013-14 COHORT 2014-15 COHORT 2015-16 COHORT MUS GRADUATION RATE Academic Year of Students' First Enrollment MUS DUAL ENROLLMENT GRADUATION RATE
Percent of MUS Students Graduating with an Associates Degree within Two Years, All MUS Students vs. Dual Enrollment MUS Students, by Cohort Year *MUS Cohort consists of first-time, full-time, associate s degree seeking students *Dual Enrollment Cohort consists of first-time, full-time, associate s degree seeking students who enrolled in dual enrollment at a MUS college 25% 21% Percent Graduated from Associate's Degree Program within Two Years 20% 19% 19% 15% 13% 12% 12% 11% 10% 10% 9% 8% 8% 7% 5% 0% 2012-13 COHORT 2013-14 COHORT 2014-15 COHORT 2015-16 COHORT 2016-17 COHORT 2017-18 COHORT Academic Year of Students' First Enrollment MUS GRADUATION RATE MUS DUAL ENROLLMENT GRADUATION RATE