NEED - Understanding US Federal Debt
National Economic Education Delegation (NEED) aims to provide nonpartisan presentations on key economic policy issues in the United States. Explore the dynamics of the US Federal Debt with insights from a network of professional economists. Learn about the underlying economic principles and data influencing the national debt and its implications on policy decisions. Delve into topics such as economic inequality, federal budgets, and more through expert viewpoints and consensus-driven analysis.

Download Presentation

Please find below an Image/Link to download the presentation.
The content on the website is provided AS IS for your information and personal use only. It may not be sold, licensed, or shared on other websites without obtaining consent from the author.If you encounter any issues during the download, it is possible that the publisher has removed the file from their server.
You are allowed to download the files provided on this website for personal or commercial use, subject to the condition that they are used lawfully. All files are the property of their respective owners.
The content on the website is provided AS IS for your information and personal use only. It may not be sold, licensed, or shared on other websites without obtaining consent from the author.
E N D
Presentation Transcript
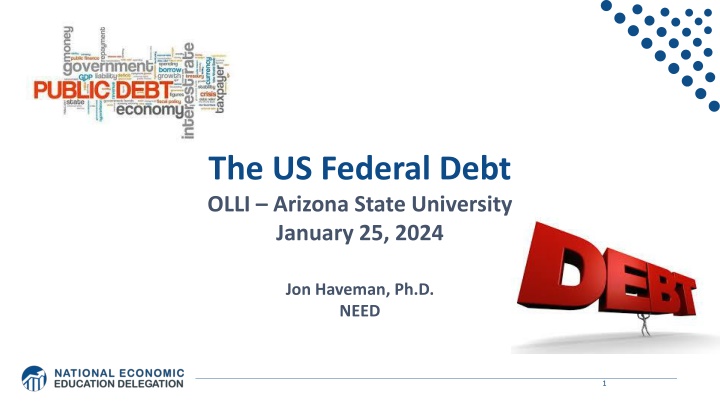
The US Federal Debt OLLI Arizona State University January 25, 2024 Jon Haveman, Ph.D. NEED 1
National Economic Education Delegation Vision - One day, the public discussion of policy issues will be grounded in an accurate perception of the underlying economic principles and data. Mission - NEED unites the skills and knowledge of a vast network of professional economists to promote understanding of the economics of policy issues in the United States. NEED Presentations - Are nonpartisan and intended to reflect the consensus of the economics profession. 2
Who Are We? Honorary Board: 54 members - 2 Fed Chairs: Janet Yellen, Ben Bernanke - 6 Chairs Council of Economic Advisers o Furman (D), Rosen (R), Bernanke (R), Yellen (D), Tyson (D), Goolsbee (D) - 3 Nobel Prize Winners o Akerlof, Smith, Maskin Delegates: 652+ members - At all levels of academia and some in government service - All have a Ph.D. in economics - Crowdsource slide decks - Give presentations Global Partners: 49 Ph.D. Economists - Aid in slide deck development 3
Available NEED Topics Include: US Economy Immigration Economics Healthcare Economics Housing Policy Climate Change Federal Budgets Economic Inequality Federal Debt Economic Mobility Black-White Wealth Gap Trade and Globalization Autonomous Vehicles Minimum Wages Healthcare Economics 6
Credits and Disclaimer This slide deck was created by: - Jon Haveman, Executive Director, NEED - Geoffrey Woglom, Amherst College, Emeritus This slide deck was reviewed by: - Olivier Blanchard, Brookings Institution Disclaimer - NEED presentations are designed to be nonpartisan. - It is, however, inevitable that presenters will be asked for and offer their own views. - Such views are those of the presenters and not necessarily those of the National Economic Education Delegation (NEED). 7
Outline First: A Budget Review And Now: The Debt Important Points About the Debt How to Think About the Debt Summary 8
What Does the US Govt. Budget Look Like? 2022 Budget Summary (in billions) Revenue Income Taxes Payroll Taxes Corporate Taxes Other Outlays Mandatory Discretionary Interest $2,632 $1,484 $425 $356 $4,134 $1,661 $475 Total $4,897 Total $6,270 Budget Deficit: $1,373 Billion 11 https://www.cbo.gov/publication/58888
But There is More to The Budget! 12 Source: https://www.cbo.gov/system/files/2023-02/58848-Outlook.pdf
What Are Tax Expenditures? Total: About $1.2 TRILLION in 2019 13 Source: https://www.pgpf.org/Chart-Archive/0199_distribution_tax_expenditures
Of Debt, Deficits, and Surpluses FLOW - Deficit: The excess of outlays over revenues in a year. - Surplus: The excess of revenues over outlays in a year. STOCK - Debt: The accumulation of debt over time. The sum of all past deficits and surpluses. 16
Debt vs. Deficit Debt = The Sum of All Past Deficits Less Surpluses 17
Major Takeaways: Talking Points The debt is not currently a significant problem. The current trajectory of federal debt is unsustainable. Given the historically low interest rates, we can afford to wait until after the crisis to act. We must enact plans to reduce the future (primary) deficits. - These are driven by Medicare and Social Security spending. The longer we postpone action, the greater the probability of a fiscal crisis. 18
How Does the US Government Borrow? It issues debt. - Treasury marketable securities: o Treasury bills, notes, and bonds o TIPS: Treasury inflation-protected securities o Savings bonds Who buys the debt? - Other federal agencies - Individuals and businesses - State and local governments - Foreign government and individuals - Federal Reserve 19
Trends in US Debt Holdings Over Time 2023, Q3: Other Domestic: 50.8% Federal Reserve: 20.3% Foreign: 28.9% 20
Who Holds Debt to Foreigners, 10/23 Foreign ownership is relatively recent in 1990 foreign ownership was less than 20% peaked at 40+% now is 28.9% Billions of U.S. Dollars 21 Source: https://www.statista.com/statistics/246420/major-foreign-holders-of-us-treasury-debt/
Why Do Foreign Investors Buy US Treasuries? Market for Treasuries is the deepest, most liquid capital market in the world. The US economy has a history of political and economic stability. The dollar is the largest international reserve currency. - Most trade transactions (e.g., oil) are quoted in dollars. - 88% of international transactions involve the dollar. - With some exceptions, foreign governments borrow in dollars. 22
35 23
Important Points: - Not all debt is created equal. - What is the right measure of the debt? 24
Not All Debt Is Created Equal Some debt can reduce the availability of investment funds to other borrowers. - Often referred to as crowding out private investment. IntRAgovernmental debt is (important) bookkeeping. - This debt DOES NOT crowd out private investment. Debt held by the public. - This debt MIGHT crowd out private investment. Most analyses of debt focus on federal debt held by the public. 25
U.S. Publicly Held Debt, December 31, 2022 26 Source: PGPF.org
A Breakdown of Total Federal Debt, 2020 29 https://www.gao.gov/americas_fiscal_future?t=federal_debt
The All-Important Relative Debt CBO analyzes the debt relative to GDP because: - To the extent that debt and deficits have burdens, these burdens depend on the size of the debt relative to the size of the economy. Relative Debt Debt/GDP Total Public Debt United States $26.3 Trillion 95.4% Greece $0.215 Trillion 170% 30
Key Points About US Relative Debt 1983 1. Relative debt peaked during World War II, followed by a long decline. 2. Prior to 1983, relative debt rose purposefully (wars and recessions) and then fell. 3. Relative debt has been and is expected to rise for the next 30 years w/o a strategic purpose. 33
Debt Dynamics Surprising (?) Facts - From 1945 to 1979, relative debt fell from 100% of GDP to 25% of GDP. - During this period, the federal budget was in surplus only 8/35 years! Relative debt is a fraction: Debt/GDP; fractions fall if: - The numerator falls (budget surplus) - The denominator rises (nominal GDP growth) - The denominator grows faster than the numerator o GDP growth is greater than the interest rate on borrowing. o CAN still run deficits and reduce the relative debt. 35
An Almost Free Lunch If the interest rate is less than the growth rate of GDP, then the contribution from the primary budget can be positive, hence Debt to GDP can be stabilized with a (small) primary deficit. 36
Is Stabilizing Relative Debt Good Enough? This means that the absolute level of the debt would continue to increase. Yes, it is probably good enough. - It is a reflection of the economy s ability to support the debt. - Stability will avoid bond market scares. More on this later. 38
But Lets Think About Today Coronavirus Pandemic WWII Great Recession Great Depression WWI 40
Why Has the Federal Debt Risen So Much? Expenditures UP: - Social Security - Health-care costs - Economic stimulus o In particular, during the Great Recession & COVID. - Military engagements overseas Revenues DOWN: - Declining income tax revenues o Stagnant wages o Tax cuts - Social security o Declining revenues 41
Tax Cuts Have Driven The Debt Increases Trump Tax Cuts: 6% of GDP Bush Tax Cuts: 32% of GDP Great Recession & COVID: 26% of GDP The rest: 34% of GDP Up from 31% in 2001 42
Thinking About Today. Do we have: - A spending problem? - A revenue problem? - Both? 43
There is very little enthusiasm for cutting anything. 44 Source, NYTimes, Paul Krugman, Why We Should, but Won t, Reduce the Budget Deficit
Thinking About Today. Do we have: - A spending problem? - A revenue problem? - Both? Not much support for it being a spending problem. 45
How To Address the Debt? The question isn t taxes vs spending cuts. The question is: - Who should bear the burden of solving the problem? o Spending cuts will mean primarily lower-income households. o Tax increases will mean primarily high-income households. o Soc Sec benefit cuts (age limit, actual payments, etc.) will mean primarily lower-income households. 46
47 Source, NYTimes, Paul Krugman, Why We Should, but Won t, Reduce the Budget Deficit
What? Its not 40%? No, its 24.1%. The 400 highest income households: Paid an average tax rate of 8%. 48 https://nymag.com/intelligencer/article/fact-check-richest-1-dont-pay-40-of-the-taxes.html
Cant StopThinking About Tomorrow 49
Now Lets Think About Today and the Future Coronavirus Pandemic WWII Great Recession Great Depression WWI 50


")