NIHR CLAHRC Yorkshire and Humber - Community of Practice for ReQoL
A collaborative platform focusing on impactful research, knowledge exchange, and synergy among critical thinkers and practitioners. Emphasizing deepening knowledge, social interaction, and identity building within a shared healthcare context.

Download Presentation

Please find below an Image/Link to download the presentation.
The content on the website is provided AS IS for your information and personal use only. It may not be sold, licensed, or shared on other websites without obtaining consent from the author.If you encounter any issues during the download, it is possible that the publisher has removed the file from their server.
You are allowed to download the files provided on this website for personal or commercial use, subject to the condition that they are used lawfully. All files are the property of their respective owners.
The content on the website is provided AS IS for your information and personal use only. It may not be sold, licensed, or shared on other websites without obtaining consent from the author.
E N D
Presentation Transcript
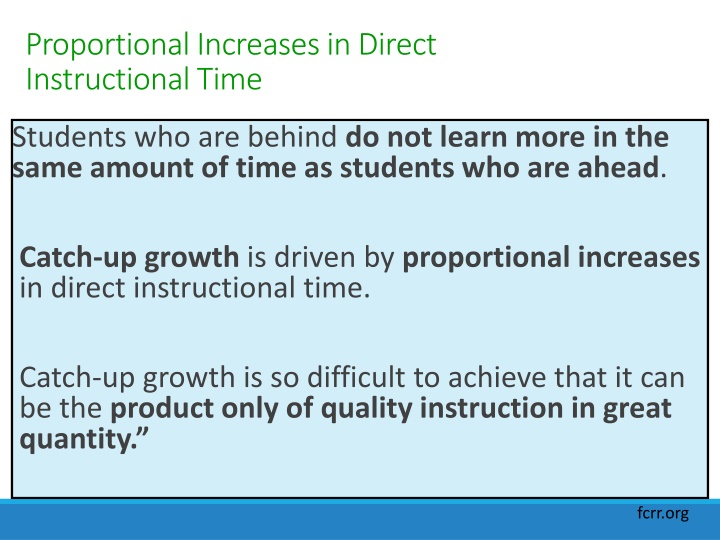
Proportional Increases in Direct Instructional Time Students who are behind do not learn more in the same amount of time as students who are ahead. Catch-up growth is driven by proportional increases in direct instructional time. Catch-up growth is so difficult to achieve that it can be the product only of quality instruction in great quantity. fcrr.org
Whether or not we achieve these goals depends on the strength of our instruction to do two things during the year Insuring students who are behind expected yearly growth plus catch growth growth who are behind make plus catch- -up up Effective differentiated core instruction by classroom teacher Effective school-level systems and resources to provide additional intensive intervention in small enough groups enough time enough time, and with , and with enough skill enough skill small enough groups for for Time X quality = growth fcrr.org
Academic learning time 50 min Engaged time on task 2 hrs Allocated time 4 hrs 6-7 hrs Available time 3
Progress Monitoring: Collecting, Interpreting, and Applying Student Data NC DPI EC DIVISION 2015 NC DPI EC DIVISION 2015- -16 16 SUPPORTING TEACHING AND RELATED SERVICES SECTION
Four Corner Activity 2. I think progress monitoring is important because 1. I think progress monitoring is 3. I don t progress monitor as often as I should because 4. The one thing I need to learn today is ADAPTED FROM 2013 DIFFERENTIATED INSTRUCTIONAL STRATEGIES PROFESSIONAL LEARNING GUIDE, GAYLE GREGORY 5
Why is progress monitoring so essential?
Project: Acceleration 4.5 4 3.5 3 2.5 Grade Level 2 1.5 1 1st Quarter 2nd Quarter 3rd Quarter 4th Quarter Typical 3rd Grade Student 3rd Grade Student with Disability
Agree - Disagree- Why The use of student work as the unrelenting focus of adult conversations can be the catalyst of fundamental changes in the educational experience of students, and the transformation of teaching and learning. Aspen Workshop Transforming High Schools Task Force, 2001
Data on Outcomes for SWD <10% of 8th grade SWDs are proficient in reading and math on the National Assessment of Educational Progress (NAEP) 63% of SWD in NC graduate high school compared to 82.5% of all students 45% report continuing to postsecondary education within 4 years of leaving high school: 32% community college 23% vocational, business or technical school 14% 4-yr university 58% work full time within 4 years of leaving high school
Learning Objectives As a result of participating in this session, participants will be able to: 1. Understand the necessity of progress monitoring for accelerating student growth 2. Summarize key features of progress monitoring in special education 3. Apply progress monitoring concepts and procedures to student performance on IEP goals 4. Generate a progress monitoring plan, graphic display of student data, and data-based IEP progress report for parents 5. Determine effectiveness of instruction/intervention and how to modify in response to data
What is progress monitoring?
Progress Monitoring Is used to assessa student s performance, quantify his or her rate of improvement or responsiveness to intervention, adjust the student s instructional program to make it more effective and suited to the student s needs, and evaluate the effectiveness of the intervention. National Center for Intensive Intervention www.intensiveintervention.org
What Progress Monitoring Is Not Standard classroom documentation Something we teach in teacher and therapist preparation programs Something done in a silo/by an individual Something done without: Appropriate tools Accurate and reliable scoring Schedule for data collection Decision rules Worth doing with interventions that are not data-informed
Not so Easy Kind of Easy Super Easy
Challenges of Progress Monitoring Requires measurable PLAAFP and goals Requires IEP team collaboration/up-front planning Requires formation of new/different documentation habits Feels like more work initially
Continuum of Assessment FORMATIVE SUMMATIVE
Continuum of Approach INFORMAL FORMAL
Continuum of Scale SKILL-BASED BROAD-BASED
Examples INFORMAL FORMAL Teacher Observations Exit Tickets White Boards Retrieval practice Clickers Student Self- Evaluation Program-Embedded Assessment Mastery Measurement (Subskill Measurement) SKILL-BASED Teacher-Created Unit Tests Common Formative Assessments District-Created Benchmarks Curriculum-Based Measurement (CBM) General Outcome Measurement BROAD- BASED
Intentional Data Collection Tools Permanent Products Event Recording Interval Recording Time Sampling Duration Latency
Direct Assessment Tools Event Recording Behavior Counting Name ____Nancy ____ Week of __July 28, 2014______ Behavior to be counted _Negative comments to peers Mon. Tue. Wed. Thurs. Fri. Total IIII IIIII II II IIIII IIIII IIIII I I 40 Arrival I I I 3 Math II I III IIII I 11 Science Art IIII IIIII IIIII III IIIII IIII I 24 Reading I II III 6
My behavior in math: Did I attempt my work? Did I ask a friend or my teacher for help if I got stuck? Did I keep working even when it was hard?
Monitoring Student Progress on IEP Goals
How Progress Will be Measured Describe how progress toward the annual goal will be measured: What performance data will be collected? In what form? With what tools/methods? How often? How much? Where? By whom?
Progress Monitoring Data: Must Haves Must have data to determine the student s present levels of performance (baseline) and to set goals for instructional outcomes Must have data to evaluate the effect of the interventions for establishing targeted skills and producing broader, more comprehensive learning gains Must have data to ensure that children in special education are experiencing reduced risk over time Kovaleski, VanDerHeyden, and Shapiro The RTI Approach to Evaluating Learning Disabilities
Characteristics of Effective Progress Monitoring Measures the behavior outlined in the goal Uses an equivalent measure each time Regular and frequent Easy to implement Takes only a short amount of time from instruction OR is embedded within instruction Is sensitive to change over time
How Often? The more discrepant the student is from the target, the frequency of PM increases Sensitivity of the target area to change (i.e. math fact fluency vs. written expression) Seven to 12 data points to make instructional decisions that are statistically valid* Must be collected at regular intervals Monitoring is ongoing and frequent enough to provide sufficient information
Trajectory for Student Success Effective SDI Sensitive Progress Monitoring Measureable Annual Goal This is data This is data- -driven individualization individualization driven Data-rich PLAAFP
Baseline Data The PLAAFP (PRESENT LEVEL OF ACADEMIC ACHIEVEMENT AND FUCNTIONAL PERFORMANCE) Current/relevant information about student performance in one domain Objective Measurable Understandable Related to participation and progress in general education
Typical IEP Measurement Mastery of series of short- term-objectives that: Don t have equivalent units Have different measurement requirements Lack reliability and validity Don t indicate/acknowledge what has already been learned Measurement feels unmanageable and/or pointless People stop measuring
Measurable Goals Time - In 18 weeks, Condition given 30 vocabulary words from the 7th grade science curriculum Learner - Lynn Action will compose on a keyboarding device Criterion at least 10 correct sentences using at least 10 vocab words within 10 minutes. Derive from PLAAFP data SMART Specific Measureable Ambitious and attainable Realistic Time-bound
Nancys Behavior Goals In 36 weeks, given a structured small group learning activity, Nancy will engage in the activity with minimal verbal cues for at least 10 minutes without aggressive/disruptive behaviors on four consecutive data collection dates. In 36 weeks, given a routine classroom task within her ability level (lining up to go outside, washing hands before snack, etc.), Nancy will initiate and complete the task with <3 prompts to start/persist and no tantrums on four consecutive data collection dates.
PM Tools for Nancys Behavior Stopwatch/clock for duration and interval observation Verbal/physical aggression event count forms Student-monitored behavior interval chart Tantrum duration data sheets Time-out event records Daily sleep duration record
Write a Measurable Goal for One Student
PLAAFP GOALS PM PLAN
Progress Monitoring Plans 1. Identify and operationally define academic, behavioral, or functional knowledge, skills, and abilities to be measured 2. Determine who, where, and how often data will be collected 3. Conduct intervention and collect multiple data points across time/settings/occasions under standardized procedures 4. Score and summarize data graphically 5. Evaluate SDI effectiveness
NANCYS PM PLAN - I Identify and operationally define the behavioral or functional knowledge, action/skill, or ability that will be measured : ROUTINE TASK PERSISTENCE continues and completes a classroom routine in a timeframe and with level of assistance commensurate with peers PARTICIPATION IN SMALL GROUP LEARNING stays in physical proximity of adult- led learning activity, orients self/attention to activity, follows directions given to group, makes on-topic verbal and/or physical contributions to activity TANTRUMS intense, inconsolable/non-redirect-able verbal and/or physical outbursts lasting more than 1 minute that inhibit engagement in classroom activity DISRUPTIVE BEHAVIOR patterns of actions that impede the ability of instructors to teach and students to learn (e.g., interrupting, creating excessive noise, fidgeting, sleeping, untimely leaving/entering instructional activity) SLEEP PATTERN number of consecutive hours student slept previous night
NANCYS PM PLAN - II Describe how often, what time of day, and where student progress will be assessed: ROUTINE TASK PERSISTENCE - Recorded 2x/week, once from arrival to 11am and once from 11am to dismissal, data collection days will vary to ensure broad view of occurrence PARTICIPATION IN SMALL GROUP LEARNING Recorded during 3 small group learning sessions per week TANTRUMS Recorded when/where ever they occur at school, within 30 minutes of tantrum cessation DISRUPTIVE BEHAVIOR - Recorded 2x/week, once from arrival to 11am and once from 11am to dismissal, data collection days will vary to ensure broad view of performance SLEEP PATTERN daily record sent from home
Nancys PM Plan - III Identify team members responsible for: Data collection teacher, TA, SLP, OT, parents, Nancy Data collection fidelity checks teacher, principal, and behavior support specialist Interpreting data to determine progress teacher, SLP, OT, and behavior support specialist Writing progress report to parents - teacher, SLP, and OT
Develop a Progress Monitoring Plan
How Progress Will Be Displayed & Interpreted Comparing expected and actual rates of progress Graphic displays: Provide clear visual representation of progress over time Increase productive communication at IEP meetings Enable students to keep track of their own progress Result in motivating students to work more diligently toward their goals
Graphing Performance Data Goal (10 min.) Baseline (2 min.) = Amount of change required (8 min.) Amount of change required (8 min.) Weeks to work on goal (36 weeks or 4 reporting periods) = Amount of change needed per week (GOAL LINE SLOPE) (.22 min./week or 2 min./reporting period) To meet goal #1, Nancy will need to engage in small group instruction an additional 2 minutes per reporting period.
Nancys Small Group Engagement Data 6 5 4 Minutes Time Engaged - AM 3 Time Engaged - PM Goal line 2 1 0 Week 1 Week 2 Week 3 Week 4 Week 5 Week 6 Week 7 Week 8 Week 9
1. Calculate a goal line 2. Plot some fake performance data
Potential Data Points for Monica GOAL 1 GOAL 2 # of times on time to work Disability explanation developed # falls & fall reports # of disability explanations delivered Supervisors Coworkers Consecutive hours worked # of tasks assigned & finished # of notices re: unsatisfactory work # of accommodation requests Time (duration) for task completion # of accommodations made # sleeping/off task episodes # of problem-solving meetings # of procedural violations