Observations of Reconnection Topologies in Turbulent Energy Cascade
This study presents observations of reconnection topologies and their impact on the turbulent energy cascade in the solar wind. Multispacecraft data reveal insights into magnetic field topology and energy transfer mechanisms at different spatial scales, shedding light on the dynamics of MHD turbulence. The findings provide valuable information on how coherent structures drive energy transfer and support a forward cascade process.

Download Presentation

Please find below an Image/Link to download the presentation.
The content on the website is provided AS IS for your information and personal use only. It may not be sold, licensed, or shared on other websites without obtaining consent from the author. If you encounter any issues during the download, it is possible that the publisher has removed the file from their server.
You are allowed to download the files provided on this website for personal or commercial use, subject to the condition that they are used lawfully. All files are the property of their respective owners.
The content on the website is provided AS IS for your information and personal use only. It may not be sold, licensed, or shared on other websites without obtaining consent from the author.
E N D
Presentation Transcript
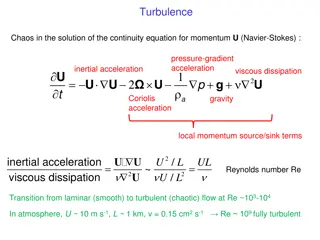
Multispacecraft Observations of Reconnection Topologies and Their Role in the Turbulent Energy Cascade C. M. Liptrott1 B. Hnat1 S. C. Chapman1 N. W. Watkins1,2 1Centre for Fusion, Space, and Astrophysics, University of Warwick 2Grantham Institute, London School of Economics National Astronomy Meeting, July 2025 B. Hnat, S. C. Chapman, C. Liptrott, N. W. Watkins, Solar wind magnetohydrodynamic turbulence energy transfer rate ordered by magnetic field topology, Phys. Rev. Lett. (2025) [Under Review]
Solar Wind Turbulence, Magnetic Topology, and Energy Transfer Rate MHD turbulence is ubiquitous in the solar wind [1] Evidence that intermittency corresponds to coherent structures [2] Coherent structure evolution drives energy transfer across spatial scales: Current sheet breakup can drive energy to smaller scales [3] Flux ropes can merge to drive energy to larger scales [4] Magnetic Field Topology Turbulent Energy Transfer Multispacecraft estimates of field topol- ogy in space domain Solar Wind Turbulent energy transfer rate using M H D Yaglom Law: 4 Sr = 3 r Constant positive energy transfer rates identified on MHD scales [5] support a forward cascade Spacecraft Tetrad [1] Bruno and Carbone, Living Rev. Solar Phys. (2013) [2] e.g. H. Wu, Honghong et al., Astrophys. J. Lett. (2023) [3] Pezzi et al., Astronomy and Astrophysics (2024) [4] Boldyrev and Loureiro, Astrophys. J (2017) [5] Sorriso-Valvo et al., Phys. Rev. Lett. (2007) C . M. Liptrott Reconnection & Turbulent Cascade N A M 2025 2 / 10
Cluster Mission Solar Wind Data Solar wind satellite observations are the only in situ observations of astrophysical scale turbulence Four spacecraft flying in formation in the solar wind/magnetosphere Magnetic field topology from Cluster-FGM 4 spacecraft magnetic field measurements. ~ 22Hz Instantaneous energy transfer rate from CIS-HIA 2 spacecraft plasma moment measurements ~ 0.25Hz INTERVAL CRITERIA: (i) Solar wind transit time tr = L/ vsw > 4s (CIS-HIA sampling rate) contemporaneous estimates (ii) Cluster tetrahedron sufficiently regular for accurate B gradient estimation (pseudo-spherical, elongation and planarity < 0.4) We identify 5 data intervals subject to... C . M. Liptrott Reconnection & Turbulent Cascade N A M 2025 3 / 10
Instantaneous Energy Transfer Rate L(t) Hall-corrected M H D Yaglom Law: 1 4 Sr = Yr + 2 Hr = 3 r, (1) where Yr and Hr are mixed third-order structure functions given by Yr = vr (| v|2 + | b|2) 2 br ( v b) t, Hr = 2 br ( b j) jr | b|2 t. is the energy transfer rate. Hall correction Hr is small compared to Yr . Here v, b, j are velocity, magnetic, and current density fields suitably normalised. Figure 1: (a) PSD (b) Sr (green) Yr (red) Hr (blue) C . M. Liptrott Reconnection & Turbulent Cascade N A M 2025 4 / 10
Instantaneous Energy Transfer Rate L(t) Hall-corrected M H D Yaglom Law: 1 4 Sr = Yr + 2 Hr = 3 r, (1) where Yr and Hr are mixed third-order structure functions given by Yr = vr (| v|2 + | b|2) 2 br ( v b) t, Hr = 2 br ( b j) jr | b|2 t. is the energy transfer rate. Hall correction Hr is small compared to Yr . Here v, b, j are velocity, magnetic, and current density fields suitably normalised. Field Increments via Time Differences (Taylor s Hypothesis): r = vsw a = a(t + ) a(t) (2) Figure 1: (a) PSD (b) Sr (green) Yr (red) Hr (blue) C . M. Liptrott Reconnection & Turbulent Cascade N A M 2025 4 / 10
Instantaneous Energy Transfer Rate L(t) Hall-corrected M H D Yaglom Law: 1 2 4 3 Sr = Yr + Hr = r, (1) where Yr and Hr are mixed third-order structure functions given by 2 Yr = vr (| v| + | b| ) 2 br ( v b) t, Hr = 2 br ( b j) jr | b| t. 2 2 is the energy transfer rate. Hall correction Hr is small compared to Yr . Here v, b, j are velocity, magnetic, and current density fields suitably normalised. Field Increments via Time Differences (Taylor s Hypothesis): r = vsw a = a(t + ) a(t) (2) Instantaneous Energy Transfer Rate L(t) Identify the instantaneous energy transfer rate L(t) such that L(t) t = at the tetrahedron scale L tr Figure 1: (a) PSD (b) Sr (green) Yr (red) Hr (blue) Contemporaneously estimate L(t) on the tetrahedron scale and magnetic field topology. C . M. Liptrott Reconnection & Turbulent Cascade N A M 2025 4 / 10
Magnetic Field Topology Classification I Bi xi Magnetic field gradient tensor, [ B] = its topological structure, current, and associated Lorentz force [1]. , contains all local field information, including ij Estimate B via linear least-squares Linear first-order least squares optimisation. Estimate gradients using spacecraft differences: B(k)(r ) B(k)(r ) B(k) (r r ) Minimise squared residuals: h i2 B(k) (r r ) B(k)(r ) B(k)(r ) subject to B = 0 [2]. [1] Parnell et al. Physics of Plasmas (1996) [2] 12 Paschmann and Daly ISSI Scientific Reports Series 1 (1998). See also Denton et al., J. Geophys. Res. Space Phys.(2023) C . M. Liptrott Reconnection & Turbulent Cascade N A M 2025 5 / 10
Magnetic Field Topology Classification II Characterise topology in R-Q Space following ref. [1] Coefficients of B characteristic polynomial: 3 + P 2 + Q i + R = 0. i i (3) Topology classified by sign of (3) discriminant: 27 R2 + Q3. D = 4 D > 0: Flux ropes/Plasmoids D < 0: 3D X-lines Reconnection Topologies Figure 2: R-Q Space Classification. Adapted from Meneveau, Ann. Rev. Fluid Mech. (2010) [1] Chong, Perry, Cantwell, Phys. Fluids (1990). Previous applications: Consolini et al. (2015, 2018), Hnat, Chapman, & Watkins (2021, 2023) C . M. Liptrott Reconnection & Turbulent Cascade N A M 2025 6 / 10
L(t) and L(t) QQ Plots to Compare Distributions of Condition L(t) on topology: L (t) = (t)|D(t) < 0 [Reconnection] L L (t) = (t)|D(t) > 0 [Plasmoids] Difference is hard to see on PDF plots [Fig. 3] L (t) L (t) Survival Curve 10 5 10 0 10 1 L Probability Density 10 6 10 2 -5 0 5 L(t) 10 7 Instead, directly compare the quantiles of ECDFs using Empirical Quantile-Quantile plots 10 8 Gives comparison of tail width/weight + more robust to extreme values -5 0 5 L(t) [102 kJ kg 1 s 1] Figure 3: PDFs of , (t) on semi-log scale Application: Tindale et al (2016, 2017) Method: Hyndman & Fan (1996) L C . M. Liptrott Reconnection & Turbulent Cascade N A M 2025 7 / 10
QQ Plots for Solar Wind Intervals: Qualitative Results Systematically larger L(t) > 0 values for D < 0 [Reconnection] vs D > 0 [Plasmoids] at all quantiles. C . M. Liptrott Reconnection & Turbulent Cascade N A M 2025 8 / 10
QQ Plots for Solar Wind Intervals: Qualitative Results Systematically larger L(t) > 0 values for D < 0 [Reconnection] vs D > 0 [Plasmoids] at all quantiles. Interval-dependent L(t) < 0 but no preference on average. C . M. Liptrott Reconnection & Turbulent Cascade N A M 2025 8 / 10
QQ Plots for Solar Wind Intervals: Qualitative Results Systematically larger L(t) > 0 values for D < 0 [Reconnection] vs D > 0 [Plasmoids] at all quantiles. Larger forward instantaneous energy transfer rates in reconnection topology Interval-dependent L(t) < 0 but no preference on average. C . M. Liptrott Reconnection & Turbulent Cascade N A M 2025 8 / 10
QQ Plots for Solar Wind Intervals: Quantitative Results Estimate y = Ax + B via linear regression on L(t) > 0 for (a) All Intervals (b) Most extreme interval C . M. Liptrott Reconnection & Turbulent Cascade N A M 2025 9 / 10
QQ Plots for Solar Wind Intervals: Quantitative Results Estimate y = Ax + B via linear regression on L(t) > 0 for (a) All Intervals (b) Most extreme interval (a) A = 1.25, (b) A = 1.60 on average 25% and up to 60% larger forward instantaneous energy transfer rates in reconnection topology [B small] C . M. Liptrott Reconnection & Turbulent Cascade N A M 2025 9 / 10
QQ Plots for Solar Wind Intervals: Quantitative Results Estimate y = Ax + B via linear regression on L(t) > 0 for (a) All Intervals (b) Most extreme interval 25% (up to 60%) larger forward instantaneous energy transfer rates in reconnection topology (a) A = 1.25, (b) A = 1.60 on average 25% and up to 60% larger forward instantaneous energy transfer rates in reconnection topology [B small] C . M. Liptrott Reconnection & Turbulent Cascade N A M 2025 9 / 10
Summary WHAT: Instantaneous energy transfer rates differ significantly between topological populations. We find, on average, 25% larger instantaneous energy transfer rates in reconnection topologies compared to flux ropes, suggesting reconnection may drive the forward cascade of energy. W H Y : 3D topology of magnetic field lines is a key feature of reconnection and turbulence. Quantifying contributions of energy transfer by different topologies may help understand the underlying physics of these phenomena. HOW: Magnetic field line topology classified and associated with with contemporaneous estimate of instantaneous energy transfer rate in 5 Cluster turbulent solar wind intervals. QQ plots compare the two populations. C . M. Liptrott Reconnection & Turbulent Cascade N A M 2025 10 / 10
Summary WHAT: Instantaneous energy transfer rates differ significantly between topological populations. We find, on average, 25% larger instantaneous energy transfer rates in reconnection topologies compared to flux ropes, suggesting reconnection may drive the forward cascade of energy. W H Y : 3D topology of magnetic field lines is a key feature of reconnection and turbulence. Quantifying contributions of energy transfer by different topologies may help understand the underlying physics of these phenomena. HOW: Magnetic field line topology classified and associated with with contemporaneous estimate of instantaneous energy transfer rate in 5 Cluster turbulent solar wind intervals. QQ plots compare the two populations. Paper Under Review: B. Hnat, S. C. Chapman, C. Liptrott, N. W. Watkins, Solar wind magnetohydrodynamic turbulence energy transfer rate ordered by magnetic field topology, Phys. Rev. Lett. (2025) Previous Related Works: B. Hnat, S. C. Chapman, N. W. Watkins, Magnetic topology of actively evolving and passively convecting structures in the turbulent solar wind, Phys. Rev. Lett., 126, 125101 (2021) https://doi.org/10.1103/PhysRevLett.126.125101 Hnat, B., Chapman, S. C, Watkins, N. Topology of turbulence within collisionless plasma reconnection. Sci. Rep. 13, 18665 (2023). https://doi.org/10.1038/s41598-023-45650-x C . M. Liptrott Reconnection & Turbulent Cascade N A M 2025 10 / 10
Interval Data Table Table 1: Data intervals. L di 1 tr [s] 6.1 7.6 8.9 6.7 6.6 Interval Date & Time 10-Feb-03 18:44-19:01 10-Feb-03 22:30-22:45 11-Feb-03 00:30-01:15 19-Feb-03 23:25-23:40 20-Feb-03 00:34-00:54 p p (di) [km] 80.6 (85.9) 79.5 (81.6) 76.7 (85.8) 139.1 (83.8) 96.4 (77.6) L(t) counts 1506 1326 4008 1416 1776 0.93 0.93 0.76 0.28 1.48 31.3 40.4 44.3 43.3 45.5 C . M. Liptrott Reconnection & Turbulent Cascade N A M 2025 10 / 10
Yaglom and Estimates We find L(t) t = = 3.4 200 kJ kg 1 s 1 Large spread in the distribution average motivated the look at the full distribution. (a) (b) Figure 4: (a) Trace of the magnetic power spectral density tensor P = ij BiBj , where i, j = x, y, z from spacecraft C3 for the interval shown in Figure 1. Blue vertical line indicates the proton gyro-frequency. (b) Variation with scale of the Yaglom structure function Y ( ) (red), Hall-corrected Yaglom structure function S( ) (blue), and Hall correction term H( ) (green) from spacecraft C1 (triangles) and C3 (squares). C . M. Liptrott Reconnection & Turbulent Cascade N A M 2025 10 / 10
MHD Turbulence Scaling Figure 5: Kiyani et al 2015 Figure 1 C . M. Liptrott Reconnection & Turbulent Cascade N A M 2025 10 / 10
LS Gradient Estimation Minimise the objective function S, where 3 N N [kn (r r ) (xn(r ) xn(r ))]2 S = (4) n=1 =1 =1 using method of Lagrange multipliers to impose B = 0 and obtain the estimator: N N 3 Bi rj 1 ( ) 1 j ( ) (B (r ) B (r ))(r r = (5) ) R , i i 2N 2 =1 =1 =1 where N ( ) (j) r r R = (6) j =1 is the so-called volumetric tensor. C . M. Liptrott Reconnection & Turbulent Cascade N A M 2025 10 / 10
Tetrahedron Quality Following [Paschmann & Daly (1998)], the volumetric tensor N ( ) (j) r r R = j = 1 contains tetrahedron geometrical information. Characterised by the ordered eigenvalues a > b > c: , b a : How stretched out spacecraft are. (stretching in two directions) , c b : How planar they are. (squashed in one direction) Characteristic scale L = 2 a. Elongation 1 Planarity 1 Figure 6: Fig 13.3 from Paschmann & Daly (1998) C . M. Liptrott Reconnection & Turbulent Cascade N A M 2025 10 / 10
Error Analysis C . M. Liptrott Reconnection & Turbulent Cascade N A M 2025 10 / 10


")
")
")


 and εL×(t)")