Oracle Exadata vs Fusion-Powered Servers: A Technology Comparison
"Discover the journey of a prominent technology company evaluating Oracle's Exadata against Fusion-Powered servers. From initial infrastructure needs to high availability solutions, find out which setup delivered the best performance and price. Explore the stages, challenges, and final outcomes in this insightful tech showdown."

Download Presentation

Please find below an Image/Link to download the presentation.
The content on the website is provided AS IS for your information and personal use only. It may not be sold, licensed, or shared on other websites without obtaining consent from the author. If you encounter any issues during the download, it is possible that the publisher has removed the file from their server.
You are allowed to download the files provided on this website for personal or commercial use, subject to the condition that they are used lawfully. All files are the property of their respective owners.
The content on the website is provided AS IS for your information and personal use only. It may not be sold, licensed, or shared on other websites without obtaining consent from the author.
E N D
Presentation Transcript
Trumping Oracle Exadata A short story
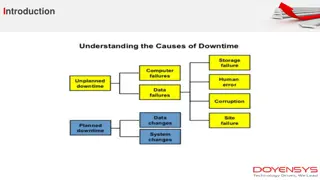
Introduction One of the world s most prominent technology companies recently evaluated Oracle s Exadata against two Fusion Powered servers. Sometimes two can be bigger than Exa.
Initial Situation Prominent technology company needs fast and reliable infrastructure to service tens to hundreds of thousands of requests per minute Architecture based on a pod-like design with many pods aggregated for scale Transaction-driven application requires disproportionate amount of storage resources and disk-optimizing acrobatics
Stage 1 Single Pod Design Two Sun T5440 servers 2x NetApp 6080s 1X Performance Acceleration Modules 12 disk shelves Output 75,000 IOPS Result Insufficient performance
Stage 2 Single Pod Design Two Sun T5440 servers 2x NetApp 6280s 2X Performance Acceleration Modules 12 disk shelves 4 shelves with SSDs Output 208,000 IOPS Result Insufficient performance
Stage 3 Single Pod Design Exadata ( rack) Bundled servers Bundled SSDs Output 9,000 transactions per second Result Insufficient performance VERY EXPENSIVE
Stage 4 Final Single Pod Design Two HP DL 580 G7 servers 10 ioDrives per server 1.28TB each, 12.8TB total Output Over 39,000 transactions per second from single server 2ndserver for failover Result Best-in-class performance Best-in-class price
High Availability no problem Oracle Dataguard Already paid for with site license RAC not required Data Guard configuration consisting of a primary database and a physical standby database. From the primary database, redo is being transmitted and applied to the standby database. Log apply services apply the redo out of the standby redo log files to the standby database. Source: Oracle.com
Final Comparison Two Fusion- powered servers Exadata ( rack) NetApp Disk Farms Improvement Transactions per second (IOPS based) 9,000 39,000+ 4.3X Four 42U (servers + NTAP) Rack space 21U 8U 2.6X Cost ~$800,000 ~$400,000 2X Pricey Dollars per transaction $89 $10 9X Transactions per rack unit 429 4875 11.3X