Oral Microbiome and Cancer Risk in Prospective Studies
Explore the significant role of the oral microbiome in cancer risk through prospective studies conducted by the National Cancer Institute's Division of Cancer Epidemiology and Genetics. High-quality population studies aim to understand cancer etiology, improve risk prediction, and enhance cancer prevention strategies by identifying microbiome features associated with developing various cancers. The studies focus on technical reproducibility, lab sample processing optimization, and the association between oral microbiome and cancers such as breast, colorectal, gastric, and pancreatic cancers. Join the initiative to move microbiome research into population studies for a better understanding and prevention of cancer risks.
Uploaded on | 1 Views
Download Presentation

Please find below an Image/Link to download the presentation.
The content on the website is provided AS IS for your information and personal use only. It may not be sold, licensed, or shared on other websites without obtaining consent from the author. If you encounter any issues during the download, it is possible that the publisher has removed the file from their server.
You are allowed to download the files provided on this website for personal or commercial use, subject to the condition that they are used lawfully. All files are the property of their respective owners.
The content on the website is provided AS IS for your information and personal use only. It may not be sold, licensed, or shared on other websites without obtaining consent from the author.
E N D
Presentation Transcript
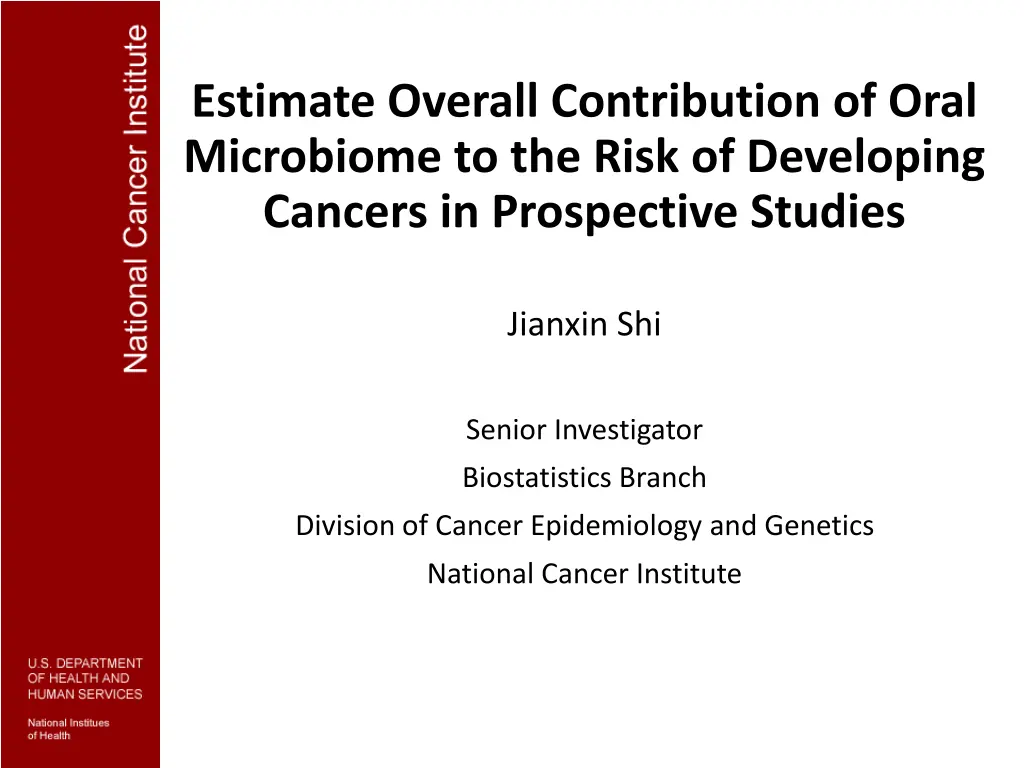
Estimate Overall Contribution of Oral Microbiome to the Risk of Developing Cancers in Prospective Studies Jianxin Shi Senior Investigator Biostatistics Branch Division of Cancer Epidemiology and Genetics National Cancer Institute
NCI/DCEG Microbiome Working Group: Moving Microbiome Research into Population Studies Perform high-quality population studies to better understand cancer etiology, to improve risk prediction and prevention of cancers.
DCEG Microbiome Studies Methods studies Technical reproducibility & overtime stability Lab sample processing optimization Cross-sectional studies Breast, colorectal, gastric and pancreatic cancers NHANES oral microbiome study (~12K samples) Prospective studies DCEG oral microbiome studies (ongoing) DCEG new cohort study for gut microbiome (planning)
P PROSPECTIVE ROSPECTIVE M MICROBIOME ICROBIOME E EPIDEMIOLOGY PIDEMIOLOGYSTUDIES STUDIES Etiology Identify taxa/microbiome features associated with the risk of developing cancers Cancer prevention Risk prediction models incorporating microbiome risk factors
Oral Microbiome and Cancer Risk: Prospective Studies Agriculture Health Study (AHS) 2012 1999 1993 1997 2003 Mouth Wash Collection n = 34,827 Recruitment n = 89,655 Current Follow-Up Prostate, Lung, Colorectal, and Ovarian Screening Trial (PLCO) 1993 2009 2001 2004 Current Follow-Up Recruitment n = 75,000 Mouth Wash Collection n = 47,250 NIH-AARP Diet and Health Study (NIH-AARP) 2011 1996 1995 200 5 Mouth Wash Collection n = 34,000 Current Follow-Up Recruitment n = 566,990 Abnet, Sinha, Vogtmann
Oral Microbiome and Cancer Risk: Prospective Studies Cancer site Bronchus/lung Colorectum Esophagus Head/neck Hepatobiliary tract Pancreas Small intestine Stomach Sum of cases Referent group Grand Total AHS 204 294 26 57 19 43 14 44 701 1000 PLCO 751 525 - - 91 - 31 60 1458 1289 NIH-AARP 542 331 43 60 47 129 29 58 1239 1000 Total 1497 1150 69 117 157 172 74 162 3398 3289 6687 AHS: Agricultural Health Study PLCO: Prostate, Lung, Colorectal and Ovarian Cancer Screening Trial
What We Have Found for Lung Cancer and Colorectal Cancer? Analysis Microbiome features: taxa relative abundance, ?- diversity and ? diversity matrices Trait: time-to-event, proportional hazard model Confounding: population, education & smoking behavior (status, intensity, initiation & cessation). Findings No findings for colorectal cancer Modest association between ?-diversity and lung cancer risk (P=0.002). No solid association between taxa and lung cancer risk.
Two Complementary Methods for Estimating Overall Contribution Notations ?? as time until cancer diagnosis ??? covariates (age, smoking, education, populations) ??? microbiome features, mean 0 & variance 1. Linear mixed model Assuming log ?1 , ,log ?? ~??? Bayesian methods to infer effect size distribution under proportional hazard model Pruning taxa to be roughly independent
Linear Mixed Model for Estimating Heritability of A Quantitative Trait Assuming an additive model ??= ? ??????+ ?? where ??~? 0,?2/|?| and ??~?(0,?2). Then, ? = ?2/(?2+ ?2) is used to quantify heritability for GWAS. We have ? = ?1, ,??~? 0, 1 ? ? + ?? , where ? is the genetic similarity matrix calculated using all SNPs. Restricted maximum likelihood (REML) can be used to estimate ?. Yang et al., Nature Genetics, 2010
Overall Contribution of Oral Microbiome to Risk of a Cancer For a microbiome study of N samples, let ??? denote normalized microbiome features, ?? is log(time-to-diagnosis), ?? is log(censoring time). Assume a subset ? with ? microbiome predictors are causal: ??= ? ??????+?? ??~? 0,?2 ? random effects, ??~?(0,?2) Variance partitioning ??? ?? = ?2+ ?2 ?2 Overall contribution defined as ? = ?2+?2.
Let GNNbe the microbiome similarity matrix averaged over all microbiome features. We have ?1, ,??~??? 0, 1 ? ?2? + ??2? . Suppose the first ? subjects are cases with known ??, the remaining ? ? are controls with unknown ??> ??. Full likelihood function is given as ??? ?1, ,???,? ???+1 ??? ??+1>??+1, ,??>?? Let ????= (?1, ,??) and ?????= (??+1, ,??). Let ? = (?,?) denote all parameters.
Under the EM algorithm framework, we have Given (?,?,??), ?????~??? truncated with ??> ??. Stochastic approximation (Robbins & Monro, 1951) + ??= + and ?=1 + ?? 2< + . Here, ?? satisfies ?=1 For example, ??= 1/?.
Covariance Matrix Approximation If ? not on boundary (? 0), we obtain covariance matrix by the Louis s missing-information identity (JRSSB, 1982): If complete data Extra variability due to missing data If ? is close to boundary, we use parametric bootstrap to obtain confidence interval.
Fast Convergence 2000 subjects, ~700-1000 controls, 1000 OTUs
Simulations 2000 subjects, ~ 700-1000 OTUs Results based on 1000 simulations ? ? s.d. Empirical NA 0.082 0.081 0.079 0.079 0.080 0.076 Theoretical NA 0.083 0.080 0.081 0.080 0.080 0.079 0.0 0.1 0.2 0.3 0.4 0.5 0.6 0.029 0.101 0.195 0.300 0.398 0.501 0.600
Analyzing NCI/DCEG Case-Cohort Data 2004 Relative abundance (RA) of OTUs (average RA>0.05%, ~1000-1500 OTUs) PLCO 16.3% 0.5% AHS 0.3% 0.2% ARPP 5.7% 0.2% Combined 6.8% (3.2%) 0.3% (2.4%) 95% CI (0.6%,13.5%) (0.0%, 4.7%) Lung cancer Colorectal cancer Presence v.s. absence (PA) of OTUs (average PA>0.5%, ~1000-1500 OTUs) PLCO 16.7% 0.3% AHS 3.2% 0.7% ARPP 13.4% 0.1% Combined 10.9% (3.9%) 0.4% (2.7%) 95% CI Lung cancer Colorectal cancer (3.3%, 18.5%) (0.0%, 5.7%) Adjusted for smoking behavior, including status, intensity, initiation age and quit time.
Refined Microbiome Features Compositional feature Two transformations log(???/??0) and CLR log(???/?) Results unchanged Presence/absence analysis Underlying relative abundance ???~(1 ?)?0+ ?????(?,?) ???~?????(??,???) ??? = ?(???> 0|???)as microbiome features
Overall Oral Microbiome Contribution Under a Proportional Hazard Model We assume the following Cox proportional hazards model ? ???? = exp ?0?? ? ?=1 ? ?????
Overall Oral Microbiome Contribution Under a Proportional Hazard Model We assume the following Cox proportional hazards model ? ???? = exp ?0?? ? ?=1 ? ????? ? ?, we can show that 1? = Under an exponential model ?0 1 ?? ? log ? ?=1 log ?? = log log ?????, with ??~? 0,1 .
Overall Oral Microbiome Contribution Under a Proportional Hazard Model We assume the following Cox proportional hazards model ? ???? = exp ?0?? ? ?=1 ? ????? ? ?, we can show that 1? = Under an exponential model ?0 1 ?? ? log ? ?=1 log ?? = log log ?????, with ??~? 0,1 . Overall contribution defined as ? ??2 ???( ?=1 1.68 + ???( ?=1 ?????) ? ? = ?????)= 1.68 + ??2 if we assume ??~ 1 ? ?0+ ??(0,?2/?).
Overall Oral Microbiome Contribution Under a Proportional Hazard Model We assume the following Cox proportional hazards model ? ???? = exp ?0?? ? ?=1 ? ????? ? ?, we can show that 1? = Under an exponential model ?0 1 ?? ? log ? ?=1 log ?? = log log ?????, with ??~? 0,1 . Overall contribution defined as ? ??2 ???( ?=1 1.68 + ???( ?=1 ?????) ? ? = ?????)= 1.68 + ??2 if we assume ??~ 1 ? ?0+ ??(0,?2/?).
Parameters Estimate Dr. Sung Duk Kim estimated parameters using Gipps sampling: ??~ 1 ? ?0+ ??(0,?2/?) Analysis results for lung cancer, ~1500 OTUs ?? 0.34 0.52 ? ? ? by method 1 6.8% 10.9% Relative abundances Presence/absence 0.32 0.35 6.1% 9.8%
Parameters Estimate Dr. Sung Duk Kim estimated parameters using Gipps sampling: ??~ 1 ? ?0+ ??(0,?2/?) Analysis results for lung cancer, ~1500 OTUs ?? 0.34 0.52 ? ? ? by method 1 6.8% 10.9% Relative abundances Presence/absence 0.32 0.35 6.1% 9.8% Results robust to other survival distributions and piece-wise constant function. Ongoing: Estimate number of discoveries and risk prediction based on estimated effect size distribution (Park et al, NG, 2013)
Summary Estimating overall contribution of microbiome and the association architecture is crucial for planning, statistically & financially, a large prospective study and to understand the upper limit of risk prediction. Two complementary methods consistently suggest that oral microbiome modestly contributes to the risk of lung but not for colorectal cancer. Accounting for temporal instability, measurement error in predictors. Methods can be immediately used to estimate heritability of survival traits.

