Overview of Eclampsia and Preeclampsia
Eclampsia is defined by the occurrence of generalized tonic-clonic convulsions associated with preeclampsia signs, happening during pregnancy, labor, or within a week post-delivery. Learn about the risk factors, etiopathogenesis, and management strategies for these serious conditions.

Uploaded on Apr 19, 2025 | 0 Views
Download Presentation

Please find below an Image/Link to download the presentation.
The content on the website is provided AS IS for your information and personal use only. It may not be sold, licensed, or shared on other websites without obtaining consent from the author.If you encounter any issues during the download, it is possible that the publisher has removed the file from their server.
You are allowed to download the files provided on this website for personal or commercial use, subject to the condition that they are used lawfully. All files are the property of their respective owners.
The content on the website is provided AS IS for your information and personal use only. It may not be sold, licensed, or shared on other websites without obtaining consent from the author.
E N D
Presentation Transcript
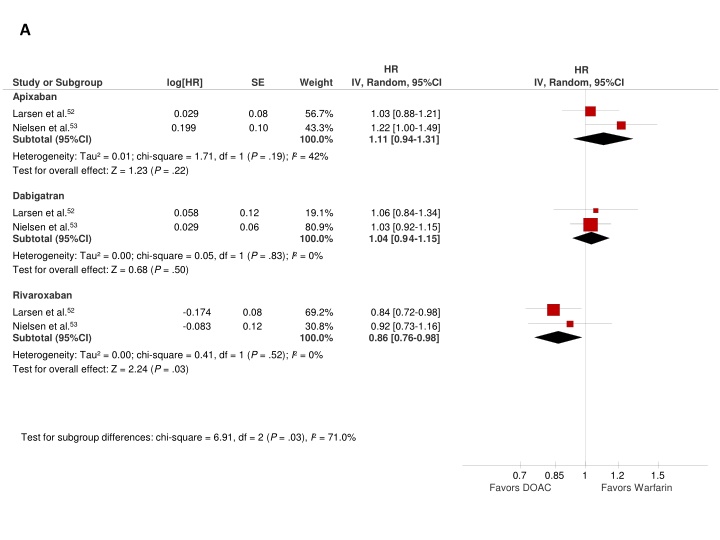
A HR HR Study or Subgroup Apixaban log[HR] SE Weight IV, Random, 95%CI IV, Random, 95%CI Larsen et al.52 Nielsen et al.53 Subtotal (95%CI) 0.029 0.199 0.08 0.10 56.7% 43.3% 100.0% 1.03 [0.88-1.21] 1.22 [1.00-1.49] 1.11 [0.94-1.31] Heterogeneity: Tau = 0.01; chi-square = 1.71, df = 1 (P = .19); I = 42% Test for overall effect: Z = 1.23 (P = .22) Dabigatran Larsen et al.52 Nielsen et al.53 Subtotal (95%CI) 0.058 0.029 0.12 0.06 19.1% 80.9% 100.0% 1.06 [0.84-1.34] 1.03 [0.92-1.15] 1.04 [0.94-1.15] Heterogeneity: Tau = 0.00; chi-square = 0.05, df = 1 (P = .83); I = 0% Test for overall effect: Z = 0.68 (P = .50) Rivaroxaban Larsen et al.52 Nielsen et al.53 Subtotal (95%CI) -0.174 -0.083 0.08 0.12 69.2% 30.8% 100.0% 0.84 [0.72-0.98] 0.92 [0.73-1.16] 0.86 [0.76-0.98] Heterogeneity: Tau = 0.00; chi-square = 0.41, df = 1 (P = .52); I = 0% Test for overall effect: Z = 2.24 (P = .03) Test for subgroup differences: chi-square = 6.91, df = 2 (P = .03), I = 71.0% 0.7 0.85 1 1.2 1.5 Favors DOAC Favors Warfarin
B HR HR Study or Subgroup Apixaban log[HR] SE Weight IV, Random, 95%CI IV, Random, 95%CI Larsen et al.52 Li et al.78 Nielsen et al.53 Subtotal (95% CI) 0.010 -0.400 0.199 0.08 0.06 0.10 33.3% 34.5% 32.2% 100.0% 1.01 [0.86-1.19] 0.67 [0.60-0.75] 1.22 [1.00-1.49] 0.93 [0.64-1.35] Heterogeneity: Tau = 0.10; chi-square = 34.61, df = 2 (P < .00001); I = 94% Test for overall effect: Z = 0.38 (P = .71) Dabigatran Larsen et al.52 Nielsen et al.53 Subtotal (95% CI) 0.010 0.029 0.11 0.06 20.8% 79.2% 100.0% 1.01 [0.81-1.26] 1.03 [0.92-1.15] 1.03 [0.93-1.13] Heterogeneity: Tau = 0.00; chi-square = 0.02, df = 1 (P = .88); I = 0% Test for overall effect: Z = 0 .50 (P = .62) Rivaroxaban Larsen et al.52 Nielsen et al.53 Subtotal (95% CI) -0.223 -0.083 0.07 0.12 71.0% 29.0% 100.0% 0.80 [0.69-0.93] 0.92 [0.73-1.16] 0.83 [0.74-0.94] Heterogeneity: Tau = 0.00; chi-square = 1.00, df = 1 (P = .32); I = 0% Test for overall effect: Z = 2.87 (P = .004) Test for subgroup differences: chi-square = 6.49, df = 2 (P = .04); I = 69,2% 0.5 0.7 1 1.5 2 Favours DOAC Favours Warfarin
C HR HR log[HR] SE Study or Subgroup Apixaban Larsen et al.52 Li et al.78 Nielsen et al.53 Subtotal (95% CI) Heterogeneity: Tau = 0.06; chi-square = 16.73, df = 2 (P = .0002); I = 88% Test for overall effect: Z = 2.09 (P = .04) Weight IV, Random, 95%CI IV, Random, 95%CI -0.462 -0.494 0.095 0.10 0.04 0.14 33.3% 37.6% 29.2% 100.0% 0.63 [0.52-0.76] 0.61 [0.56-0.66] 1,10 [0,84-1,44] 0.73 [0.55-0.98] Dabigatran Larsen et al.52 Nielsen et al.53 Subtotal (95% CI) Heterogeneity: Tau = 0.03; chi-square = 7.59, df = 1 (P = .006); I = 87% Test for overall effect: Z = 1.82 (P = .07) -0.386 -0.116 0.08 0.05 47.5% 52.5% 100.0% 0.68 [0.58-0.80] 0.89 [0.80-0.99] 0.78 [0.60-1.02] Rivaroxaban Larsen et al.52 Nielsen et al.53 Subtotal (95% CI) Heterogeneity: Tau = 0,00; chi-square = 1.54, df = 1 (P = .21); I = 35% Test for overall effect: Z = 1.24 (P = .22) 0.029 0.174 0.07 0.09 59.8% 40.2% 100.0% 1.03 [0.90-1.18] 1.19 [0.99-1.43] 1.09 [0.95-1.25] Test for subgroup differences: chi-square = 8.88, df = 2 (P = .01), I = 77.5% 0.5 0.7 1 1.5 2 Favours DOAC Favours Warfarin
D HR HR log[HR] SE Study or Subgroup Apixaban Weight IV, Random, 95%CI IV, Random, 95%CI 0.24 Larsen et al.52 Subtotal (95% CI) -0.186 100.0% 100.0% 0.83 [0.52-1.32] 0.83 [0.52-1.32] Heterogeneity: Not applicable Test for overall effect: Z = 0.78 (P = .43) Dabigatran Avgil et al. <7560 Avgil et al. >7560 Larsen et al.52 Subtotal (95% CI) -0.635 -0.511 -0.942 0.23 0.12 0.19 24.2% 45.2% 30.6% 100.0% 0.53 [0.34-0.83] 0.60 [0.47-0.77] 0.39 [0.27-0.56] 0.51 [0.39-0.67] Heterogeneity: Tau = 0.03; chi-square = 3.66, df = 2 (P = .16); I = 45% Test for overall effect: Z = 4.93 (P < .00001) Rivaroxaban Larsen et al.52 Subtotal (95% CI) -0.415 0.19 100.0% 100.0% 0.66 [0.45-0.97] 0.66 [0.45-0.97] Heterogeneity: Not applicable Test for overall effect: Z = 2.13 (P = .03) Test for subgroup differences: chi-square = 3.49, df = 2 (P = .17), I = 42.7% 0.2 0.5 1 2 5 Favours DOAC Favours Warfarin