Paradigm Shift in OLAP Modeling: Envisioning New Query Models

After neglecting end-user analysis, a paradigm shift is needed in OLAP modeling. Explore the intentional analytics model for redefined query handling and data manipulation at different levels of processing.

Uploaded on Apr 04, 2025 | 0 Views
Download Presentation

Please find below an Image/Link to download the presentation.
The content on the website is provided AS IS for your information and personal use only. It may not be sold, licensed, or shared on other websites without obtaining consent from the author.If you encounter any issues during the download, it is possible that the publisher has removed the file from their server.
You are allowed to download the files provided on this website for personal or commercial use, subject to the condition that they are used lawfully. All files are the property of their respective owners.
The content on the website is provided AS IS for your information and personal use only. It may not be sold, licensed, or shared on other websites without obtaining consent from the author.
E N D
Presentation Transcript
The road to highlights is paved with good intentions: envisioning a paradigm shift in OLAP modeling Panos Vassiliadis Patrick Marcel University of Ioannina, Hellas University of Tours, France
Why the need for a paradigm shift? After many years of research on efficiency, ETL, highly distr. progr., , we have neglected what kind of analysis we offer to end-users Unless we provide a principled way to handle end-user operations, the industry will do it before us (again) and in ad-hoc manner (again) We envision a paradigm shift for OLAP, meaning that we need to . Re-invent / Revive / Redefine OLAP with A new model of what a query is A new model of what a query answer is http://www.cs.uoi.gr/~pvassil/publications/2018_DOLAP 2
Redefining what a query is THE INTENTIONAL ANALYTICS MODEL http://www.cs.uoi.gr/~pvassil/publications/2018_DOLAP 3
Intentional Analytics model SQL aggregate queries At the beginning: Reporting, but the kid-who- knows-programming Focused on HOW TO GIVE THE BOSS WHAT I THINK HE NEEDS Direct implementation in SQL at the db level http://www.cs.uoi.gr/~pvassil/publications/2018_DOLAP 4
Intentional Analytics model OLAP: Roll-Up, Drill- Down, Drill-Across, Slice On-line processing, by the user himself, focused on WHAT DATA I NEED Manipulation at the cube level SQL aggregate queries At the beginning: Reporting, but the kid-who- knows-programming Focused on HOW TO GIVE THE BOSS WHAT I THINK HE NEEDS Direct implementation in SQL at the db level http://www.cs.uoi.gr/~pvassil/publications/2018_DOLAP 5
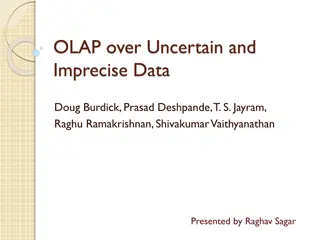
Intentional Analytics model OLAP: Explain, Predict, Focus, On-line processing, mostly by the tool, focused on WHAT IS THE GOAL OF MY ANALYSIS (data is for the db, Info is for the user) Manipulation at the INTENTION level I want the tool, to explain to me, why sales are dropping OLAP: Roll-Up, Drill- Down, Drill-Across, Slice On-line processing, by the user himself, focused on WHAT DATA I NEED Manipulation at the cube level SQL aggregate queries At the beginning: Reporting, but the kid-who- knows-programming Focused on HOW TO GIVE THE BOSS WHAT I THINK HE NEEDS Direct implementation in SQL at the db level http://www.cs.uoi.gr/~pvassil/publications/2018_DOLAP 6
Operator: Analyze Analyze: I want details on the data you present Implemented via one drill down or all possible (Cinecubes detail operator) http://www.cs.uoi.gr/~pvassil/publications/2018_DOLAP 8
Operator: Compare Compare: contrast a cube/cell with its peer, similar cubes/cells Implemented via drill across or Cinecubes put-in- context operator http://www.cs.uoi.gr/~pvassil/publications/2018_DOLAP 9
Operator: Verify Verify: check if a pattern you observe happens also at a broader context Implemented via Relax operator (observe that the specific part on the left is generalized to all parts at the right) http://www.cs.uoi.gr/~pvassil/publications/2018_DOLAP 10
Operator: Abstract Abstract: show me less details and a broader context Implemented via Rollup, clustering, shrink, etc (here: abstract the year dimension) http://www.cs.uoi.gr/~pvassil/publications/2018_DOLAP 11
Operator: Explain Explain: show me what makes a difference Implemented via the Diff operator (here in the Fig.) or outlier detection, etc http://www.cs.uoi.gr/~pvassil/publications/2018_DOLAP 12
Operator: FocusOn Focus On: constrain the scope of analysis Implemented via sliceNDice, skyline, winnow (top- k), etc. http://www.cs.uoi.gr/~pvassil/publications/2018_DOLAP 13
Operator: Predict Predict: forecast future values Implemented via typical timeseries analysis methods (regression, ARIMA, ) as well as classification methods http://www.cs.uoi.gr/~pvassil/publications/2018_DOLAP 14
Operator: Suggest Suggest: any hint on what should I ask now? Implemented via query recommenda tion techniques, or via operators like Inform http://www.cs.uoi.gr/~pvassil/publications/2018_DOLAP 15
How do we change querying? Focus on the actual goal of the analyst and NOT on the data she wants to get Let the system decide which data to fetch OPEN ISSUE: instead of executing EVERY single OLAP operator that corresponds to an intentional operator can we AUTOMATICALLY optimize (a) what we execute and (b) what we show (see next too) Also in the paper: vision of a language for composing operators On-Going work: further reduce the set of operators, by abstracting even more! http://www.cs.uoi.gr/~pvassil/publications/2018_DOLAP 16
OK, we redefined what an OLAP query is, but this is not enough. We also suggest that we urgently need to REDEFINE WHAT THE ANSWER TO AN OLAP QUERY IS http://www.cs.uoi.gr/~pvassil/publications/2018_DOLAP 17
Caught somewhere in time Query result = (just) a set of tuples No difference from the 70 s when this assumption was established and tailored for what people had available then a green/orange monochrome screen a dot-matrix(?) printer nothing else users being programmers 18 Photos copied from http://en.wikipedia.org/
The answer to a query can be a set of tuples (traditionally) a data movie that includes a set of complementary queries supporting a data story, whose results are properly visualized, enriched with textual comments, and vocally enriched (DOLAP13 Cinecubes for reporting) http://www.cs.uoi.gr/~pvassil/publications/2018_DOLAP 19
The answer to a query can be a set of tuples (traditionally) a data movie that includes a set of complementary queries supporting a data story, whose results are properly visualized, enriched with textual comments, and vocally enriched (DOLAP13 Cinecubes for reporting) a dashboard that apart from data, also comes with (i) the automatic mining of models and patterns, and (ii) the extraction of jewels hidden in the result, which we call highlights, plus, the aforementioned (iii) visuals and generated text (for OLAP) http://www.cs.uoi.gr/~pvassil/publications/2018_DOLAP 20
Data analysis and models We consider the plugging of data analysis algorithms in the back-stage of a dashboard as an indispensable part of OLAP. These algorithms can range from very simple ones (e.g., finding the top values of a cuboid, or detecting whether a dimension value is systematically related to top or bottom sales) to very complicated ones (like, classification, outlier detection, dimensionality reduction, etc). The findings of these automatically invoked and executed data analysis algorithms will be the models of the data http://www.cs.uoi.gr/~pvassil/publications/2018_DOLAP 21
Data analysis and models The findings of automatically invoked and executed data analysis algorithms will be the models of the data Due to the vastness of the possible models, we need to automatically assess them on their significance for the user and retain the most important ones, which we call highlights http://www.cs.uoi.gr/~pvassil/publications/2018_DOLAP 22
and what are models and highlights? Models: concise information-rich abstractions that mine relationships and properties from data Here: (@2) a trend analysis of past sales produces a list of expected values + a classification of deviation of achieved sales compared to the actual, labels the result; (@5) an outlier analysis identifies points with high outlierness 23
and what are models and highlights? Highlights: important parts of models, linked to data Here: (@2) sales = 35 having a large deviation from expected and classified as important is an important part of the model; similarly, (@5) the outlier is important too 24
Model components, data and highlights Models have model components, that can link to source data e.g., time series model splits a time series measure to trend, seasonality and noise => the source measure is annotated with them A cluster model = a set of clusters => the source cells can be annotated with the id of the cluster to which they belong. A classification model groups source data by the label of the class to which they belong. A model of top-k values of a measure labels source cells with their rank. Components are linked to their respective data: A notable property of our modeling is that we require model components to be directly mapped and linked to their generating data in a bidirectional mapping, so that the end-user can navigate back and forth between cube cells and their models. Highlights are produced by identifying components with interesting information, according to the user s intention http://www.cs.uoi.gr/~pvassil/publications/2018_DOLAP 25
Important questions & challenges Stay tuned for the long version of the paper for sketch of solutions for: How do we select which algorithms to execute, how to fine-tune them, and how do we do it in real time? How do we select highlights out of the vast number of models generated? Must investigate interestingness wrt intention solutions for: How do we handle the heterogeneity of models? How do we put data and highlights to work together? open for the future: How do we plug in (a) visualizations and (b) storytelling? http://www.cs.uoi.gr/~pvassil/publications/2018_DOLAP 26
Concluding, we redefine what an OLAP query must be & propose Intention queries via intentional operators, that the user can use instead of R-UP s, DD s with more ease Compare, Analyze, Explain, Predict, Verify, Focus, Abstract, redefine what the answer to an OLAP query must be = a dashboard with Data from several data cubes Models with information-rich properties/relationships Highlights with interesting pointsOfFocus Visuals and Generated Text encourage & invite the community to actively pursue this research avenue now! Thank you! http://www.cs.uoi.gr/~pvassil/publications/2018_DOLAP 27