Pareto Tail Adjustments in Income Distribution Analysis
Explore the effectiveness of Pareto tail adjustments in bridging the gap between survey results and administrative data regarding income distribution and inequality. This study delves into the challenges and benefits of adjusting survey data with a Pareto distribution, providing insights into the level of uncertainty and the potential alignment with tax-augmented data.
Download Presentation

Please find below an Image/Link to download the presentation.
The content on the website is provided AS IS for your information and personal use only. It may not be sold, licensed, or shared on other websites without obtaining consent from the author. If you encounter any issues during the download, it is possible that the publisher has removed the file from their server.
You are allowed to download the files provided on this website for personal or commercial use, subject to the condition that they are used lawfully. All files are the property of their respective owners.
The content on the website is provided AS IS for your information and personal use only. It may not be sold, licensed, or shared on other websites without obtaining consent from the author.
E N D
Presentation Transcript
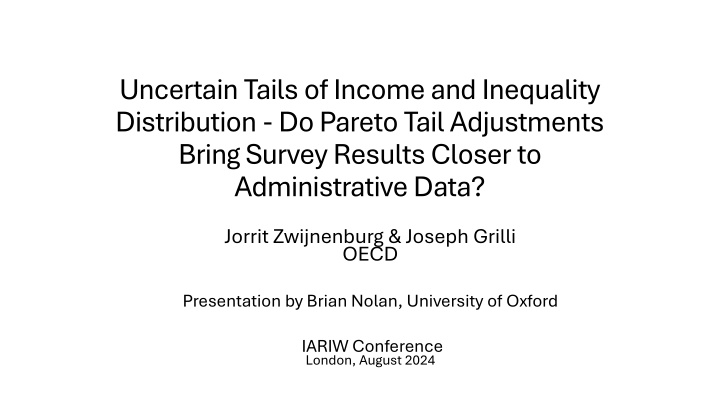
Uncertain Tails of Income and Inequality Distribution -Do Pareto Tail Adjustments Bring Survey Results Closer to Administrative Data? Jorrit Zwijnenburg & Joseph Grilli OECD Presentation by Brian Nolan, University of Oxford IARIW Conference London, August 2024
Background/Context Household surveys are widely thought to underestimate top of income distribution, for several reasons Availability of top income share estimates from tax data has reinforced this concern Various approaches to adjust/correct survey data to address this have been developed and implemented Long-standing approach involves fitting a Pareto distribution to top Salient issue more generally but here in the context of Distributional National Account (DINA)
Background/Context Important distinction between individual country studies and those aiming to apply a consistent approach across countries Administrative (tax) data can be very helpful on top incomes but there are often legal, technical, and conceptual challenges to incorporate this data An approach that does not draw on tax data for top is thus more straightforward to apply across countries [though WIL pursues a different strategy]
Background/Context As part of G20 Data Gaps Initiative, OECD creating distributional national accounts relying on micro data from LIS Using Pareto distribution to adjust for possible missing top observations Applied to components of primary income aligned with national accounts This paper applies such Pareto adjustments to LIS data for Netherlands extending approach from Zwijnenburgh, Grilli and Engelbrecht (IARIW, 2022) Compares results to Statistics Netherlands distribution which combines survey and tax micro data (described in Bruil, RoIW 2023) Provides estimates of degree of uncertainty around adjustments and measures extent to which they bring estimates closer to tax-augmented data
The Approach Distinguish NA primary income elements in survey micro-data and align with NA: Operating surplus and mixed incomes Wages and salaries Employers social contributions (actual and imputed) Interest, dividends received Rent received (actual and imputed) Investment Income attributable to insurance policy holders and to collective investment funds shareholders Investment income payable on pension entitlements - imputed Interest and rent paid Note further adjustments required to align with country s specific national accounting practices
The Approach After alignment, coverage of NA totals for components in survey (before any adjustment) ranges from almost 80% for wages and salaries to 39% for interest and dividends Some components imputed rent , rental income and Investment income attributable to collective investment funds shareholders substantially over-represented in survey, due to differences in derivation and coverage of item
The Approach Estimate Pareto Type 1 and Generalized Pareto distributions for each income component, and test whether evidence of an upper truncation point exists. tail may be well-covered by the data for some items (Pseudo-)maximum likelihood estimation provides point estimates for shape parameter for both and additional scale parameter for Generalized Pareto lower and upper threshold parameters in model are defined as lowest value in top 10% and greatest value in dataset Areas of missing density identified, synthetic households sampled from this region and added
The Approach Assessing validity of results requires confidence bounds to see whether adjusted micro data are statistically similar to administrative data Here derived likelihood functions for various specifications are used to construct sandwich estimators for the variance and provide standard errors and confidence bands for estimated parameters These are for components but confidence intervals for overall income shares also required for comparisons with estimates from/using tax data Monte-Carlo approach implemented to draw sets of parameters for each top-tail adjustment and calculate aggregate top income shares for each
Results: Model Estimates Comparing fit of Pareto Type 1 and Generalized Pareto, each Untruncated and Truncated, for individual income components: Generalized Pareto Function without truncation is preferred specification for most components Investment Income attributable to Insurance Policy Holders only exception For Generalized Pareto untruncated clearly preferred to truncated for most components Though truncated often marginally preferred for Pareto 1
Results: Estimated Aggregate Income Shares Income group Income group ranked by ranked by Primary Primary Income Income Share of Share of Primary Primary Income in Income in survey survey Share after Share after adjustment adjustment to NA totals to NA totals + after Pareto + after Pareto Top Top Adjustment Adjustment Share in Share in Statistics Statistics Netherlands Netherlands Combined Combined Distribution Distribution 38.0 Top 10% 33.4 37.6 38.8 Next 40% 56.3 53.5 52.8 52.8 Next 30% 10.2 9.0 8.4 9.2 Bottom 20% 0.08 -0.05 -0.03 -0.02
Results: Estimated Component Income Shares Share of Share of component component going to Top going to Top 10% by Primary 10% by Primary Income Income Wages and Salaries Operating Surplus Mixed Income Share in Share in survey survey Share after Share after adjustment adjustment to NA totals to NA totals + after Pareto + after Pareto Top Top Adjustment Adjustment Share in Share in Statistics Statistics Netherlands Netherlands Combined Combined Distribution Distribution 27.4 29.5 27.7 28.4 17.2 17.0 16.9 16.9 42.7 53.0 53.9 53.3 Property Income 80.5 84.8 89.5 89.4
Results: Differences between Fully Adjusted and Stats Netherlands Estimates no decile reports a deviation in the results above 1 percentage point for any of the items. The sizes and occurrences of the differences also appear to be random across deciles and items. But note: Adjustment to NA totals with no top correction has greater impact than correction to top Top 10% share after all adjustments is 0.8 higher than Stats Neth, balanced by share of deciles 3-5 being lower Correction to top actually widens (doubles) gap to Stats Neth estimates for top 10% and deciles 3-5 while perfectly aligning deciles 6-9 Correction to top widens gap for top 10% share wrtwages and salaries while substantially improving it for property income
Results: Differences between Fully Adjusted and Stats Netherlands Estimates
Results: Estimated Confidence Intervals Share going to Top Share going to Top 10% 10% Estimated Estimated Share after NA Share after NA and Pareto and Pareto adjustments adjustments Lower bound Lower bound Upper bound Upper bound Primary Income 38.8 38.4 39.6 Wages and Salaries 28.4 28.2 28.6 Operating Surplus 16.9 16.6 16.9 (?) Mixed Income 53.9 53.4 54.6 Property Income 89.5 87.2 94.6
Results: Differences between Fully Adjusted and Stats Netherlands Estimates For 60 decile share estimates - for 5 income component + overall primary income - 23 Stats Neth figures are in the confidence interval range for the fully adjusted estimates, compared to 8 in the micro data, and 17 in the national accounts aligned data. This is largely due to improvements in property income received, the item most susceptible to differential non-response and therefore most affected by top-tail adjustments, and B5, which includes this effect in aggregation. Pareto top-tail adjustment can be considered to make significant improvements in matching administrative data compared to micro data or national accounts aligned micro data
Conclusions/Implications Results show that the application of Pareto top tail adjustments have statistically significant impacts on the shares of items held by different income deciles and brings results closer to those using administrative data
Commentary Key features of the approach here vis-a-vis other top income correction approaches: 1) Implemented at level of individual income components rather than total household market/disposable income 2) Does NOT incorporate tax (or Rich Lists) data on top incomes into correction procedure 3) Does adjust survey income components to NA totals
Some High-Level Questions How different would results be if Generalized Pareto model estimated for Primary income aggregate and adjustment applied at that level rather than for/to components? But is key lesson that aligning amounts to NA totals at component level is critical element only correcting at top is not adequate? What are advantages and disadvantages of this approach versus ones incorporating external information about top incomes (from tax or Rich Lists) directly into estimation process, how can we evaluate relative merits of these broad strategies?
One View Under certain conditions, income-selective non-compliance with an initially randomized assignment can be corrected by reweighting the data. This requires that the surveys pick up at least some top incomes. If not, then income tax records can help, including in estimating distributional national accounts. However, tax data come with their own concerns An appropriately weighted survey-based distribution ... need not be less reliable for most purposes of distributional analysis than income-tax records, including in combination with surveys. The choice will depend on the question to be addressed, and country-specific circumstances. Ravallion, 2022
Some Minor Questions Is choice of top 10% in estimating models salient, results robust to other choices? Is explanation/treatment of items where surveys over-state NA totals satisfactory? Is it surprising that top adjustment does not improve coverage of e.g. wages and salaries? What is role of confidence intervals for estimates when we have benchmark true(er) figures is it not just the gap between point estimates that we should focus on? Generalising from this individual case?


