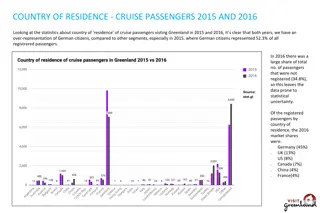
Predicting Student Success: Machine Learning for NCLEX Outcomes
Explore the use of SPSS Modeler and STATISTICA in predicting student success on high-stakes examinations like NCLEX-RN. Learn about machine learning algorithms, stability of predictive models, and the collaboration with experts in the field. Discover the nuts and bolts of predicting NCLEX outcomes and the importance of achieving benchmark pass rates.

Download Presentation

Please find below an Image/Link to download the presentation.
The content on the website is provided AS IS for your information and personal use only. It may not be sold, licensed, or shared on other websites without obtaining consent from the author. If you encounter any issues during the download, it is possible that the publisher has removed the file from their server.
You are allowed to download the files provided on this website for personal or commercial use, subject to the condition that they are used lawfully. All files are the property of their respective owners.
The content on the website is provided AS IS for your information and personal use only. It may not be sold, licensed, or shared on other websites without obtaining consent from the author.
E N D
Presentation Transcript
Using SPSS Modeler and STATISTICA to Predict Student Success on High-Stakes Examinations Dr. Galina Belokurova Assistant Director, Institutional Research Dr. Chiarina Piazza Associate Dean, College of Nursing 1
Dr. Chiarina Piazza Associate Dean, College of Nursing
NCLEX Pass Rate CA 2012/13 WCU http://www.rn.ca.gov/education/passrates.shtml
Our BHAG Achieve 75% NCLEX-RN pass rate to meet BRN benchmark Achieve 80% NCLEX-RN pass rate to meet CCNE benchmark
Dr. Galina Belokurova Assistant Director, Institutional Research
Nuts & Bolts of Predicting NCLEX Outcomes I. II. Machine Learning III. Accuracy (Bias) and Stability (Variance) of Predictive Algorithms IV. Do results differ across software packages (includes comparative demonstration of SPSS Modeler 16 and STATISTICA)? Predict vs Explain ** Parts of this project were developed in collaboration with Dr. Mahmoud Albawaneh and Dr. Mark Riddle 6
Machine Learning Unsupervised: the computer assigns observations to groups based on their similarity / difference (K-means) Supervised: the computer uses variables provided by the researcher to group observations (C&RT, Regression, Discriminant, C5.0) Today we specifically focus on the second one 7
Stability of ML Algorithms Unlike many traditional statistical methods, ML techniques rely on computational solutions and random sampling How can we be sure that the results bear some connection to reality if there is no assumed distribution for comparison? Experiment! 8
Preview 0. Pre-Modeling Tasks (data issues/balancing/ partition) 1. Predictors 2. Modeling 3. Evaluation 4. Output / Deployment 9
0.1 Data 1. Data Profiling (column/structure/business rules studies) 2. Data Quality (empty source tables / columns, nulls, inconsistent / invalid values, coding) 3. Data Warehouse: Star Schema (fact table and dimensions) 4. Meaningful Data Input (each row is a graduate, no duplicates) 10
0.2 Why do we need balancing? Relatively few NCLEX failures in the data We know more about why students pass than why they fail 11
0.3 Why do we need partition? Training and Testing Subsamples Training use for grouping Testing helps check model s accuracy and precision Models are built on different training and testing subsamples on each run. This is the source of variance. 12
1. Predictors Demographic Institutional (program track, campus, status) Course performance details (min and max grade) Aggregate measures of academic performance Entrance exams (min and max) Independent ATI Assessments (min and max) Virtual Coach 13
C&R Tree II 18
Model Evaluation What are a correct and a wrong predictions? New Data Predicted Fail Predicted Pass Actual Fail 70 35 Actual Pass 21 482 How do we evaluate C&R Trees and other classification models? Partition Training % in Training Testing % in Testing Correct 511 88 552 91 Wrong 67 12 56 9 Total 578 100 608 100 20
Accuracy (Bias): Boosting Combine different models in one to improve accuracy. Can be prone to overfitting 22
Reduce Variance: Bagging Bagging is basically bootstrap averaging 24
Other Ensembles SPSS Modeler offers an automatic routine for creating an ensemble 27
Output 1. The output includes predicted outcome (Pass/Fail) and the probability of it occurring 2. Practitioners can decide how to assign costs of certain outcomes occurring 3. False Positives are costlier than False Negatives 4. False Positives can be treated as Negatives if the confidence is low 28
Deployment Tips New Data Predicted Fail Predicted Pass Actual Fail 70 35** Actual Pass 21 482 **False Positives are in Red 30
Using STATISTICA Similar Models, Data Miner Recipes (automated) Boosted Trees and Random Forests (Bagging) pose as separate entities 31
Balancing: More Control Possible to create a stratified random sample Easy to verify the composition of training and testing samples 32
Review Results are surprisingly stable if predictors are strong Models may vary in how they split observations into groups, but the big picture stays stable Software packages also matter as proprietary algorithms may produce slightly different results, but the big picture is stable as well 33
Achieving BHAG Steps Taken: Continued Partnership with ATI Core teams assembled who are dedicated to remediating students at risk (STARs) Mechanisms developed to identify STARs early in core nursing program Necessary resources provided for NCLEX success Results: 2015-2016 WCU pass rate projected to be 87% 2016 Q3 CA pass rate was 95%
NCLEX Pass Rate CA 2014/15 http://www.rn.ca.gov/education/passrates.shtml
Sustaining BHAG Steps Ahead: Create NCLEX Success Pathways according to the metrics determined to best reflect a student s need for remediation


: Boosting")