Quantitative Aspects of Drug Action: Dose Response Curves and Antagonism
In this lecture, you will learn to recognize different dose-response curves, understand their therapeutic utility, and classify types of antagonism. Explore affinity and efficacy of drugs in binding to receptors and activating responses. Discover the concepts of potency, efficacy, and dose-response relationships through graded dose-response curves. Compare the relative potency and efficacy of drugs to produce specific effects and differentiate between different types of agonists based on their efficacy and potency.

Download Presentation

Please find below an Image/Link to download the presentation.
The content on the website is provided AS IS for your information and personal use only. It may not be sold, licensed, or shared on other websites without obtaining consent from the author.If you encounter any issues during the download, it is possible that the publisher has removed the file from their server.
You are allowed to download the files provided on this website for personal or commercial use, subject to the condition that they are used lawfully. All files are the property of their respective owners.
The content on the website is provided AS IS for your information and personal use only. It may not be sold, licensed, or shared on other websites without obtaining consent from the author.
E N D
Presentation Transcript
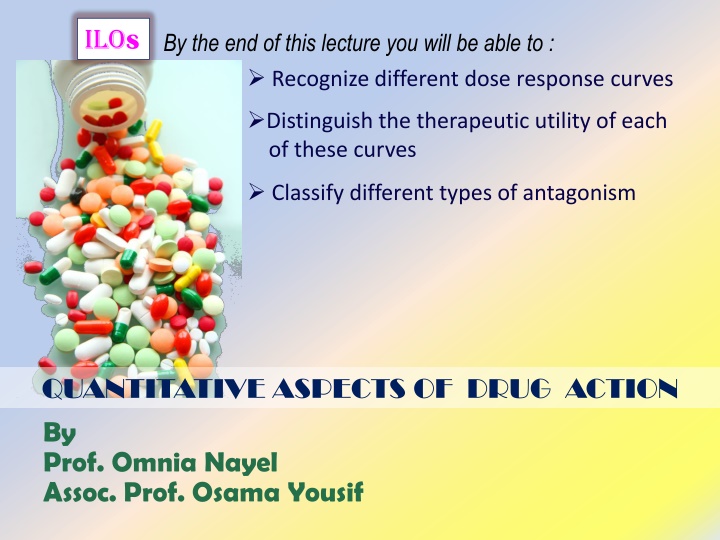
ilos By the end of this lecture you will be able to : Recognize different dose response curves Distinguish the therapeutic utility of each of these curves Classify different types of antagonism QUANTITATIVE ASPECTS OF DRUG ACTION By Prof. Omnia Nayel Assoc. Prof. Osama Yousif
The tendency of a drug to bind to the receptors is governed by its affinity. AFFINITY The ability for it, once bound, to activate the receptor is denoted by its efficacy. EFFICACY Initiate Activate Bind Occupy D + R D R RESPONSE[R] DR* Relate concentration [C] of D used (x- axis) to the BINDING CAPACITY at receptors (y-axis) Relate concentration [C] of D used (x- axis) to the Response Produced (y-axis) Concentration-Binding Curve Dose Response Curve AFFINITY EFFICACY POTENCY
DOSE RESPONSE CURVE GRADED DOSE RESPONSE CURVE QUANTAL DOSE RESPONSE CURVE
GRADED DOSE RESPONSE CURVE A continuous response BP, HR, FBG, Cholesterol,
GRADED DOSE RESPONSE CURVE Max effect = Emax Effect when all the receptors are occupied by D 100 100 As C response increment 80 80 60 % of Maximal Effect % of Maximal Effect 60 40 40 20 20 0 0 0 EC50 200 400 600 800 1 10 100 1000 [C] [C] EC50 C that gives the half-maximal effect 1.The max efficacy (Emax) highest limit of dose-response relationship on response axis. 2.The potency = The concentration of drug required to produce a specified response The smaller the EC50 , the greater the potency of the agonist, i.e the lower C needed to elicit the maximum biological response. 3. Compare the relative potency and efficacy of drugs that produce the same effect. Graded dose-response curves are used to determine:
GRADED DOSE RESPONSE CURVE A > efficacy than B B Partial Agonist EFFICACY POTENCY A > potent B
GRADED DOSE RESPONSE CURVE X & Z are equal efficacy X & Z > efficacy than Y Y > potent but < efficacious than Z X > potent than Y & Z Y> potent than Z
DOSE RESPONSE CURVE GRADED DOSE RESPONSE CURVE QUANTAL DOSE RESPONSE CURVE
All-non responses * specified therap. response * adverse response * lethal outcome QANTAL DOSE RESPONSE CURVE % subjects responding Dose-frequency relationship
QANTAL DOSE RESPONSE CURVE: used to determine 100 Lethal Effect % subjects responding 80 Toxic Effect Therapeutic Effect 60 Predict the safety profile 40 LD50 20 ED50 TD50 [Dose] 0 1 10 100 1000 1. Median Effective Dose 2.Median toxic dose 3. Median lethal dose 1. 50% of individuals exhibit the specified therapeutic response 2. toxic effects 3. death TD50 ED50 effect versus that producing the unwanted effect. When low the drug has a narrow margin of safety digoxin When high the drug has a safe profile diazepam The relation between dose to induce a desired Therapeutic Index
ANTAGONISM It is the diminution or the complete abolishment of the effect of one drug in the presence of another. Types Pharmacokinetic Non- Chemical Competitive The antagonist effectively reduces the concentration Two drugs react chemically resulting in loss of activity of active drug of the active drug at the site of action Phenobarbitone induces an accelerated hepatic metabolism warfarine Physiological Receptor Blockade Competitive Dimercaprol reduces heavy metal toxicity [ lead, .] Two drugs possess opposing actions in the body, so tend to cancel each other s effect Omeprozole & histamine
Antagonist block at some point the chain of events that ignite the response of agonist ANTAGONISM Non- Agonist and Antagonist can be bound simultaneously Competitive Reversible Receptor Blockade Competitive Antagonist prevents binding of agonist to the receptor at the same binding site ( = competes with it at same occupancy site ) Irreversible Agonist and Antagonist compete ( only one is bound)
COMPETATIVE ANTAGONISM Antagonist readily dissociate from binding site of agonist to the receptor Reversible Antagonism can be overcomed by increasing concentration of agonist = Surmountable Atropine vs Ach Irreversible Antagonist form stable, permanent / near permanent chemical bond with receptor. Inactivation lasts for duration of receptor turnover or its de- novo synthesis explains its longevity of action Phenoxybenzamine & Noradrenaline
Competitive Antagonism Reversible Parellel shift to the right, without any change in slope or maximum Irreversible No parellel shift but both a decrease in slope and a reduced maximum are obtained.
Competitive vs Noncompetative Antagonism Antagonism can be overcomed by increasing concentration of agonist = SURMOUNTABLE % of Maximal Effect Agonist + reversible competitive antagonist 100 Agonist Agonist + irreversible competitive antagonist 80 60 Agonist + non-competitive antagonist Depression of maximal response +/- rightward shifts Verapamil vs noradrenaline 40 20 [C] 0 1 10 100 1000 Antagonism cannot be overcomed by increasing concentration of agonist = NON-SURMOUNTABLE