Refining Healthy Food Access in Urban Areas
Addressing challenges of food deserts in Minneapolis and St. Paul, Minnesota through demographic analysis and spatial weighting of food store locations. Explore the importance of healthy food access, the impact of food security, and definitions of food deserts by various organizations.

Download Presentation

Please find below an Image/Link to download the presentation.
The content on the website is provided AS IS for your information and personal use only. It may not be sold, licensed, or shared on other websites without obtaining consent from the author.If you encounter any issues during the download, it is possible that the publisher has removed the file from their server.
You are allowed to download the files provided on this website for personal or commercial use, subject to the condition that they are used lawfully. All files are the property of their respective owners.
The content on the website is provided AS IS for your information and personal use only. It may not be sold, licensed, or shared on other websites without obtaining consent from the author.
E N D
Presentation Transcript
Food Deserts in Minneapolis and St. Paul, Minnesota: Refining Healthy Food Access through Demographic Analysis and Spatial Weighting of Food Store Locations Thomas Whitfield Capstone Project Proposal 14 December 2016
What is My Interest? Challenges with food deserts in urban areas can go unnoticed My move to Minneapolis in 2002 I did not own a car Decisions about housing had to be made with this in mind Family assistance allowed for me to get reliable transportation prior to the move What about others who are not as fortunate? Thomas Whitfield Capstone Project Proposal 2
Contents Food Environment Food Security Food Deserts Importance of healthy food access Examples of how food environments have been identified Objectives Methods Summary of Project Processes and Expected Outcomes Timeline References Thomas Whitfield Capstone Project Proposal 3
Food Security 12.7% of households considered to be food insecure at some point during the year in 2015 5.0% of households deemed very insecure 12.7% 5.0% Coleman-Jensen, Rabbitt, Gregory, & Singh, 2016 Thomas Whitfield Capstone Project Proposal 4
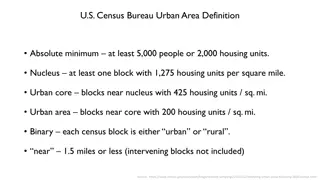
Food Desert Definitions USDA: a region of higher concentrations of low income households that have poor access to healthy and affordable food options (2009) Centers for Disease Control and Prevention: areas that lack access to affordable fruits, vegetables, whole grains, lowfat milk, and other foods that make up the full range of a healthy diet (2012) Food Empowerment Project: affordable access to healthy foods is very limited or nonexistent due to few to no options within a reasonable travel distance (2016) Thomas Whitfield Capstone Project Proposal 5
Food Desert Definition USDA 1. Low Income 2. Low Access (10 miles) USDA, 2016a Thomas Whitfield Capstone Project Proposal 6
Importance of Healthy Food Access Broader adverse health effects (USDA, 2009) Increased weight-related diseases Obesogenic environment (Chen & Kwan, 2015) Sugar as part of regular diets (Drewnowski & Rehm, 2014) Continued food choices offering poor nutritional value Economics of discretionary foods Majority still purchased at supermarkets (An & Maurer, 2016) Higher resistance to inflation (Michimi & Wimberly, 2010) Thomas Whitfield Capstone Project Proposal 7
Factors Affecting Food Deserts Availability Accessibility Affordability Acceptability Accommodation adequacy of the supply of healthy food location and ease of getting to locations food prices and perceptions of value attitudes about local food environment taking consumers habits and needs into account Caspi, Sorensen, Subramanian, & Kawachi, 2012 Thomas Whitfield Capstone Project Proposal 8
Availability Rural areas Smaller cities do not offer many food choices Economically unviable for larger grocery stores that are serviced by few residents (Smith & Morton, 2009) Urban areas London, Ontario, as an urban case study (Larsen & Gilliland, 2008; 2009) Increased resources but suburbanization displaces large food stores Better transportation infrastructure but access to that is limited Inconsistent or no vehicle access Times and routes of public transit Thomas Whitfield Capstone Project Proposal 9
Supermarket Locations in London, Ontario Larsen & Gilliland, 2008 Thomas Whitfield Capstone Project Proposal 10
How Low Access Is Defined Distance to shopping Euclidean Manhattan Network Travel time Home as a basis vs. other locations Work School Other regular trips Economic accessibility Income Poverty rate Education levels Vehicle availability Neighborhood dynamics Leete, Bania, and Sparks-Ibanga, 2012; Shannon, 2016; USDA, 2009; Zenk et al., 2005 Thomas Whitfield Capstone Project Proposal 11
Supermarket Access in London, Ontario Larsen & Gilliland, 2008 Thomas Whitfield Capstone Project Proposal 12
Accessibility Issues and Limitations Inconsistent definitions of food stores (Larson, Story, & Nelson, 2009) Store choices by researchers reflect ease of calculations (Leete, Bania, & Sparks-Ibanga, 2012) Cultural shopping habits Difficult to define (Widener, Farber, Neutens, & Horner, 2013) One-stop solutions might not change established shopping habits (Shannon, 2016) Thomas Whitfield Capstone Project Proposal 13
Changing Perceptions Combating discretionary foods through legislation Soda/sugary beverage tax in Philadelphia (Aubrey, 2016) Fast food restaurant moratorium in South Los Angeles (Sturm & Hattori, 2015) Subsidize healthy foods (Michimi & Wimberly, 2010) Nutrition education and community outreach (An & Maurer, 2016; Caspi, Sorensen, Subramanian, & Kawachi, 2012) Let s Move! initiative (Barnes, 2010) Thomas Whitfield Capstone Project Proposal 14
Summary Food Insecurity Despite improvements, food insecurity is still a major problem Suburbanization of food stores leaves those in urban areas with fewer options Access to stores is largely dependent on affordable transportation Discretionary foods are more affordable to consumers and more profitable for stores Broader health concerns stemming from nutritionally poor food choices Thomas Whitfield Capstone Project Proposal 15
Limitations of Past Studies Euclidean distance does not effectively measure access Manhattan block distance (Zenk et al., 2005) Network distance Travel to and from stores is only done along networks Limitations using two-dimensional methods for measuring phenomena constrained to networks (Xie & Yan, 2008) Shown to be more effective in similar research areas than standard density analysis (Yamada & Till, 2004) Thomas Whitfield Capstone Project Proposal 16
Traffic Accident Analysis Borruso, 2008 Thomas Whitfield Capstone Project Proposal 17
Traffic Accident Analysis Xie & Yan, 2008 Thomas Whitfield Capstone Project Proposal 18
Objectives of This Study Examine the food environment of Minneapolis and St. Paul Compare the food environment to certain socioeconomic variables indicative of limited resources to determine food desert areas Compare the food deserts derived from this study to those used by the USDA Thomas Whitfield Capstone Project Proposal 19
Study Area: Minneapolis and St. Paul 2015 Population Estimates Region Population 3,005,419 412,517 300,353 Households 1,176,655 176,878 115,164 7-County Metro Minneapolis St. Paul Minneapolis St. Paul Minnesota State Demographic Center, n.d. Thomas Whitfield Capstone Project Proposal 20
Low Access to Grocery Stores (2010) Hennepin County 341,806 29.7% Ramsey County 124,480 24.5% USDA, 2016b Thomas Whitfield Capstone Project Proposal 21
Food Deserts USDA USDA, 2016a Thomas Whitfield Capstone Project Proposal 22
Perceived Barriers to Food Access Determinants of food consumption in rural Minnesota and Iowa (Smith & Morton, 2009) Elevated food prices Poor food quality and variety Limited alternative procurement choices Welcoming attitude for food assistance programs or increased access Detailed study in Minneapolis (Shannon, 2016) Economic and access concerns Limited hours and proximity of alternative procurement choices Thomas Whitfield Capstone Project Proposal 23
Factors Behind Shopping Practices Shannon, 2016 Thomas Whitfield Capstone Project Proposal 24
Trips Distances to Minneapolis Food Stores Shannon, 2016 Thomas Whitfield Capstone Project Proposal 25
Methods Data Socioeconomic data representative of low income and low access Thomas Whitfield Capstone Project Proposal 26
Methods Data Socioeconomic data representative of low income and low access Dataset Description Format Source Housing Cost Burden Renter- and owner-occupied households in which greater than 30% of income is spent on housing Polygon geodatabase at blockgroup level 2014 ACS, Minnesota Geospatial Commons Thomas Whitfield Capstone Project Proposal 27
Methods Data Socioeconomic data representative of low income and low access Dataset Description Format Source Housing Cost Burden Renter- and owner-occupied households in which greater than 30% of income is spent on housing Where low wage jobs exist and where employees of those jobs live Polygon geodatabase at blockgroup level 2014 ACS, Minnesota Geospatial Commons Metro Council, Minnesota Geospatial Commons Low Wage Job Density Smoothed surface derived from census block level data Thomas Whitfield Capstone Project Proposal 28
Methods - Data Socioeconomic data representative of low income and low access Food store data accurate representation of food stores Preliminary study Google Earth Capstone project ReferenceUSA database (InfoGroup, 2016) Thomas Whitfield Capstone Project Proposal 29
Methods - Data Socioeconomic data representative of low income and low access Food store data accurate representation of food stores Preliminary study Google Earth Capstone project ReferenceUSA database Road and transit network information Thomas Whitfield Capstone Project Proposal 30
Methods - Data Socioeconomic data representative of low income and low access Food store data accurate representation of food stores Preliminary study Google Earth Capstone project ReferenceUSA database Road and transit network information Existing USDA food desert designations for comparison Thomas Whitfield Capstone Project Proposal 31
Methods Analysis Socioeconomic data Create density surfaces using Kernel Density Estimation (KDE) Determine clustering independent of neighbors using K-function analysis Thomas Whitfield Capstone Project Proposal 32
Methods Analysis Socioeconomic data Create density surfaces using Kernel Density Estimation (KDE) Determine clustering independent of neighbors using K-function analysis Food store data Geolocate food stores using address information Thomas Whitfield Capstone Project Proposal 33
Methods Analysis Socioeconomic data Create density surfaces using Kernel Density Estimation (KDE) Determine clustering independent of neighbors using K-function analysis Food store data Geolocate food stores using address information Rank food stores based on the availability of healthy foods Store Type Rank Score Supermarket 6 Healthy 5 Grocery 4 Small Store 2 Convenience/Other 1 Thomas Whitfield Capstone Project Proposal 34
Methods Analysis Socioeconomic data Create density surfaces using Kernel Density Estimation (KDE) Determine clustering independent of neighbors using K-function analysis Food store data Geolocate food stores using address information Rank food stores based on the availability of healthy foods Derive density surfaces using KDE and network-based KDE Determine clustering independent of neighbors using K-function and network-based K-function analyses Thomas Whitfield Capstone Project Proposal 35
Methods Analysis Socioeconomic data Create density surfaces using Kernel Density Estimation (KDE) Determine clustering independent of neighbors using K-function analysis Food store data Geolocate food stores using address information Rank food stores based on the availability of healthy foods Derive density surfaces using KDE and network-based KDE Determine clustering independent of neighbors using K-function and network-based K-function analyses Compare results to USDA food desert designations Thomas Whitfield Capstone Project Proposal 36
Methods Analysis ArcGIS Spatial Analyst Kernel Density Estimation Multi-Distance Spatial Cluster Analysis (K-function) Spatial Autocorrelation (Moran s I) SANET Spatial Analysis across Networks (Okabe, 2015) Network-constrained spatial analysis Free academic license Standalone product Toolbox for ArcGIS Xie & Yan, 2008 Thomas Whitfield Capstone Project Proposal 37
Expected Outcomes Series of maps showing the distributions of socioeconomic data and food store data Areas of high Housing Cost Burden should correlate to low densities of healthy food stores Areas of greater Low Wage Job Density should correlate to low densities of healthy food stores Compare standard and network-based analyses New definition of food desert regions based on these criteria and analyses USDA designations will differ significantly from this definition Thomas Whitfield Capstone Project Proposal 38
Timeline January 2017 Compile food store locations ReferenceUSA database Groundtruth stores to check database accuracy Geolocate stores by address Rank stores by type Obtain socioeconomic data Download census tract data from Minnesota Geospatial Commons Derive density surfaces Calculate K-functions Thomas Whitfield Capstone Project Proposal 39
Timeline February 2017 Derive ranked food store densities KDE Network-based KDE Calculate standard and network-based K-functions Determine food desert locations from these data High values of socioeconomic indicators Low values of food stores Create a geodatabase containing food desert designations Thomas Whitfield Capstone Project Proposal 40
Timeline March 2017 Compare the newly derived data to existing USDA data How much do socioeconomic indicators overlap? How much do food desert delineations overlap? Examine the effectiveness of using network-based KDE and K-function analyses versus standard versions Compile suggestions for further research Finalize Capstone presentation April 2017: Present Capstone Project at the AAG Annual Meeting in Boston Thomas Whitfield Capstone Project Proposal 41
References An, R., & Maurer, G. (2016). Consumption of sugar-sweetened beverages and discretionary foods among US adults by purchase location. European Journal of Clinical Nutrition, (August 2015), 1 5. https://doi.org/10.1038/ejcn.2016.136 Aubrey, A. (2016). Taxing Sugar: 5 Things To Know About Philly s Soda Tax : The Salt : NPR. Retrieved November 1, 2016, from http://www.npr.org/sections/thesalt/2016/06/09/481390378/taxing-sugar-5-things-to-know-about-phillys-proposed-soda-tax Barnes, M. (2010). Solving the problem of childhood obesity within a generation: White House Task Force on Childhood Obesity - Report to the President. Borruso, G. (2008). Network density estimation: A GIS approach for analysing point patterns in a network space. Transactions in GIS, 12(3), 377 402. https://doi.org/10.1111/j.1467-9671.2008.01107.x Caspi, C., Sorensen, G., Subramanian, S. V., & Kawachi, I. (2012). The local food environment and diet: A systematic review. Health & Place, 18(5), 1172 1187. https://doi.org/10.1016/j.healthplace.2012.05.006 Centers for Disease Control and Prevention. (2012). A Look Inside Food Deserts. Retrieved December 3, 2016, from http://www.cdc.gov/features/FoodDeserts/ Chen, X., & Kwan, M.-P. (2015). Contextual Uncertainties, Human Mobility, and Perceived Food Environment: The Uncertain Geographic Context Problem in Food Access Research. American Journal of Public Health, 105(9), 1734 1737. https://doi.org/10.2105/AJPH.2015.302792 Coleman-Jensen, A., Rabbitt, M. P., Gregory, C. A., & Singh, A. (2016). Household Food Security in the United States in 2015. USDA Economic Research Report Number 215, September. Retrieved from http://www.ers.usda.gov/webdocs/publications/err215/err-215.pdf Drewnowski, A., & Rehm, C. D. (2014). Consumption of added sugars among US children and adults by food purchase location and food source. The American Journal of Clinical Nutrition, 100(3), 901 7. https://doi.org/10.3945/ajcn.114.089458 Thomas Whitfield Capstone Project Proposal 42
References Food Empowerment Project. (2016). Food Deserts. Retrieved November 17, 2016, from http://www.foodispower.org/food-deserts/ InfoGroup. (2016). ReferenceUSA Home. Retrieved November 14, 2016, from http://resource.referenceusa.com/ Larsen, K., & Gilliland, J. (2008). Mapping the evolution of food deserts in a Canadian city: supermarket accessibility in London, Ontario, 1961-2005. International Journal of Health Geographics, 7(1), 1 16. https://doi.org/10.1186/1476-072X-7-16 Larsen, K., & Gilliland, J. (2009). A farmers market in a food desert: Evaluating impacts on the price and availability of healthy food. Health & Place, 15(4), 1158 1162. https://doi.org/10.1016/j.healthplace.2009.06.007 Larson, N. I., Story, M. T., & Nelson, M. C. (2009). Neighborhood Environments: Disparities in Access to Healthy Foods in the U.S. American Journal of Preventive Medicine, 36(1), 74 81.e10. https://doi.org/10.1016/j.amepre.2008.09.025 Leete, L., Bania, N., & Sparks-Ibanga, A. (2012). Congruence and Coverage: Alternative Approaches to Identifying Urban Food Deserts and Food Hinterlands. Journal of Planning Education and Research, 32(2), 204 218. https://doi.org/10.1177/0739456X11427145 Michimi, A., & Wimberly, M. C. (2010). Associations of supermarket accessibility with obesity and fruit and vegetable consumption in the conterminous United States. International Journal of Health Geographics, 9(49), 1 14. https://doi.org/10.1186/1476-072X-9-49 Minnesota State Demographic Center. (n.d.). Our Estimates. Retrieved November 21, 2016, from http://mn.gov/admin/demography/data-by-topic/population- data/our-estimates/ Okabe, A. (2015). Welcome to SANET. Retrieved November 7, 2016, from http://sanet.csis.u-tokyo.ac.jp/ Shannon, J. (2016). Beyond the Supermarket Solution: Linking Food Deserts, Neighborhood Context, and Everyday Mobility. Annals of the American Association of Geographers, 106(1), 186 202. https://doi.org/10.1080/00045608.2015.1095059 Thomas Whitfield Capstone Project Proposal 43
References Smith, C., & Morton, L. W. (2009). Rural Food Deserts: Low-income Perspectives on Food Access in Minnesota and Iowa. Journal of Nutrition Education and Behavior, 41(3), 176 187. https://doi.org/10.1016/j.jneb.2008.06.008 Sturm, R., & Hattori, A. (2015). Diet and obesity in Los Angeles County 2007-2012: Is there a measurable effect of the 2008 Fast-Food Ban ? Social Science and Medicine, 133, 205 211. https://doi.org/10.1016/j.socscimed.2015.03.004 USDA. (2009). Access to Affordable and Nutritious Food: Measuring and Understanding Food Deserts and Their Consequences. Retrieved November 17, 2016, from http://www.ers.usda.gov/webdocs/publications/ap036/12716_ap036_1_.pdf USDA. (2016a). Food Access Research Atlas. Retrieved November 21, 2016, from http://www.ers.usda.gov/data-products/food-access-research-atlas.aspx USDA. (2016b). Food Environment Atlas. Retrieved December 3, 2016, from https://www.ers.usda.gov/data-products/food-environment-atlas/ Widener, M. J., Farber, S., Neutens, T., & Horner, M. W. (2013). Using urban commuting data to calculate a spatiotemporal accessibility measure for food environment studies. Health & Place, 21, 1 9. https://doi.org/10.1016/j.healthplace.2013.01.004 Xie, Z., & Yan, J. (2008). Kernel Density Estimation of traffic accidents in a network space. Computers, Environment and Urban Systems, 32, 396 406. https://doi.org/10.1016/j.compenvurbsys.2008.05.001 Yamada, I., & Thill, J.-C. (2004). Comparison of planar and network K-functions in traffic accident analysis. Journal of Transport Geography, 12, 149 158. https://doi.org/10.1016/j.jtrangeo.2003.10.006 Zenk, S. N., Schulz, A. J., Israel, B. A., James, S. A., Bao, S., & Wilson, M. L. (2005). Neighborhood racial composition, neighborhood poverty, and the spatial accessibility of supermarkets in metropolitan Detroit. American Journal of Public Health, 95(4), 660 7. https://doi.org/10.2105/AJPH.2004.042150 Thomas Whitfield Capstone Project Proposal 44
Any Questions? http://www.wrongingrights.com/2009/02 Use permission via Creative Commons license. Thomas Whitfield Capstone Project Proposal 45


")