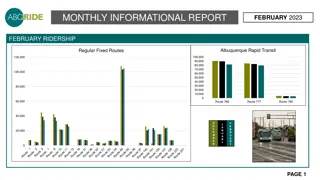
Explore the ridership report for February 2023, including fixed-route ridership data, total ridership comparisons, budget variances, and local service productivity metrics. Dive into the insights to understand how SORTA's ridership fares against national trends.
Please find below an Image/Link to download the presentation.
The content on the website is provided AS IS for your information and personal use only. It may not be sold, licensed, or shared on other websites without obtaining consent from the author. If you encounter any issues during the download, it is possible that the publisher has removed the file from their server.
You are allowed to download the files provided on this website for personal or commercial use, subject to the condition that they are used lawfully. All files are the property of their respective owners.
The content on the website is provided AS IS for your information and personal use only. It may not be sold, licensed, or shared on other websites without obtaining consent from the author.
E N D
Presentation Transcript
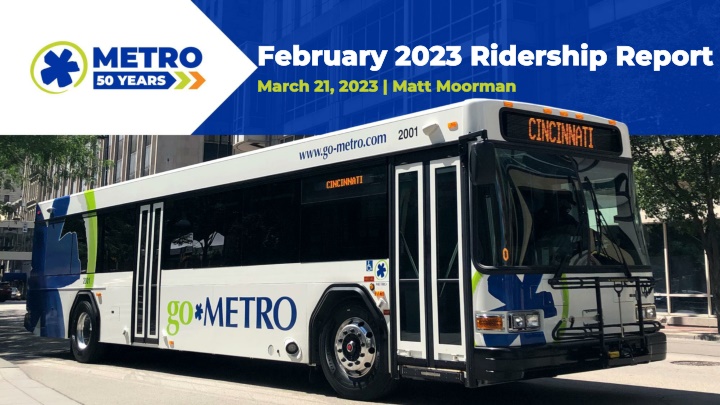
February 2023 Ridership Report February 2023 Ridership Report March 21, 2023 | Matt Moorman March 21, 2023 | Matt Moorman
Total Fixed-Route Ridership 1,200,000 1,000,000 800,000 600,000 400,000 200,000 0 Mar Apr May Jun Jul Aug Sep Oct Nov Dec Jan Feb Previous Year Current Year Budget Feb-23 Feb-22 Service Budget Variance % Budget Variance Ridership Budget Ridership 2022 Variance % Variance Local 978,586 828,589 149,997 18.1% 638,233 340,353 53.3% Express 24,954 18,904 6,050 32.0% 16,964 7,990 47.1% Totals 1,003,540 847,493 156,047 18.4% 655,187 348,353 53.2% Total (YTD) 2,032,246 1,817,159 215,087 11.8% 1,269,216 763,030 60.1%
Total Fixed-Route Ridership (Since 2019) 1,400,000 1,200,000 1,000,000 800,000 600,000 400,000 200,000 0 M 19 M 19 M 20 M 20 M 21 M 21 M 22 M 22 O 19 O 20 O 21 O 22 J 19 J 19 J 20 J 20 J 20 J 21 J 21 J 21 J 22 J 22 J 22 J 23 D 19 D 20 D 21 D 22 F 19 A 19 A 19 S 19 N 19 F 20 A 20 A 20 S 20 N 20 F 21 A 21 A 21 S 21 N 21 F 22 A 22 A 22 S 22 N 22 F23
Average Daily Ridership (WD, SA, SU) Since 2021 45,000 40,000 35,000 30,000 25,000 20,000 15,000 10,000 5,000 0 Jan-22 Jan-23 May-21 Oct-21 May-22 Oct-22 Apr-21 Jun-21 Aug-21 Apr-22 Jun-22 Aug-22 Feb-21 Mar-21 Nov-21 Feb-22 Mar-22 Nov-22 Feb-23 Jul-21 Sep-21 Dec-21 Jul-22 Sep-22 Dec-22 Weekday Rides Saturday Rides Sunday Rides Feb 2023 Avg Daily Feb 2023 Avg Daily Budget Budget Variance Feb 2022 Avg Daily Feb 22- Feb 23 Variance Service WEEKDAY 42,647 36,703 17.0% 28,290 50.7% SATURDAY 21,527 16,115 33.6% 12,756 68.8% SUNDAY 16,125 12,245 31.7% 9,589 68.2%
Local Service Productivity (last 12 months) Local Service Cost Recovery % (last 12 months) 20 20% 18 18% 16 16% 14 14% 12 12% 10 10% 8 8% 6 6% 4 4% 2 2% 0 0% M A M J J A S O N D J F M A M J J A S O N D J F Local PPH KPI Local Local KPI Local Local Service Feb 2023 Actual KPI Feb 2023 Budget KPI Variance Passengers Per Hour (PPH) 18.6 15.9 2.7 Cost Recovery 14.2% 10% 4.2%
Express Service Productivity (last 12 months) Express Service Cost Recovery % (last 12 months) 12 25% 10 20% 8 15% 6 10% 4 5% 2 0 0% M A M J J A S O N D J F M A M J J A S O N D J F Express PPT KPI Express Express KPI Express Local Service Feb 2023 Actual KPI Feb 2023 Budget KPI Variance Passengers Per Trip (PPT) 7.5 11.4 -3.9 Cost Recovery 4.0% 19.0% -15.0%
Fixed-Route Missed Trips by Month (since 2021) 3,500 3,000 2,500 2,000 1,500 1,000 500 0 M 21 M 21 M 22 M 22 J 21 J 21 J 22 J 22 J 22 J 23 O 21 O 22 N 21 D 21 F 22 N 22 D 22 F 23 A 21 A 21 S 21 A 22 A 22 S 22 Actual Total Trips Pct. Of Trips Operated Missed Trips 1,775 62,000 97.1%
Total Access Ridership 18,000 16,000 14,000 12,000 10,000 8,000 6,000 4,000 2,000 0 Feb Mar Apr May Jun Jul Aug Sep Oct Nov Dec Jan Past Year Current Year Budget Jan 2023 Ridership 14,063 12,862 521 680 14,063 Jan 2023 Budget 12,054 Budget Variance 16.7% Jan 2022 Ridership 11,682 10,820 444 418 11,682 Jan 22- Jan 23 Variance 20.4% 18.9% 17.3% 62.7% 20.4% Total Weekday Saturday Sunday Total (Year-to-Date) 12,054 16.7%
Total Access Ridership by Month (since 2019) 25,000 20,000 15,000 10,000 5,000 0 M 19 M 19 M 20 M 20 M 21 M 21 M 22 M 22 O 19 O 20 O 21 O 22 J 19 J 19 J 19 J 20 J 20 J 20 J 21 J 21 J 21 J 22 J 22 J 22 J 23 D 19 D 20 D 21 D 22 F 19 A 19 A 19 S 19 N 19 F 20 A 20 A 20 S 20 N 20 F 21 A 21 A 21 S 21 N 21 F 22 A 22 A 22 S 22 N 22
On-Time Performance - Access (last 12 months) 100% 95% 90% 85% 80% 75% 70% Feb Mar Apr May Jun Jul Aug Sep Oct Nov Dec Jan Access OTP KPI
Access Service Productivity (last 12 months) Access Service Cost Per Rider (last 12 months) 3.00 $80 2.75 $70 2.50 2.25 $60 2.00 $50 1.75 1.50 $40 1.25 $30 1.00 0.75 $20 0.50 $10 0.25 0.00 $0 Feb Mar Apr May Jun Jul Aug Sep Oct Nov Dec Jan Feb Mar Apr May Jun Jul Aug Sep Oct Nov Dec Jan Productivity KPI Cost Per Rider KPI Access Service Jan 2023 Actual Jan 2023 KPI Variance Cost Per Passenger $53.90 $55.00 -$1.10 On-Time Performance 91.5% 94.0% -2.5% Passengers Per Hour 2.2 2.2 0 Cost Recovery 8.0% 14% -6.0%


 Since 2021")