San Ramon Unified 2022 Redistricting Analysis
This analysis delves into the redistricting process of San Ramon Unified School District in 2022, highlighting redistricting rules, existing trustee areas, current trustee area demographics, and key considerations. The goal is to ensure fair representation, adherence to federal laws, and preservation of communities of interest.

Download Presentation

Please find below an Image/Link to download the presentation.
The content on the website is provided AS IS for your information and personal use only. It may not be sold, licensed, or shared on other websites without obtaining consent from the author.If you encounter any issues during the download, it is possible that the publisher has removed the file from their server.
You are allowed to download the files provided on this website for personal or commercial use, subject to the condition that they are used lawfully. All files are the property of their respective owners.
The content on the website is provided AS IS for your information and personal use only. It may not be sold, licensed, or shared on other websites without obtaining consent from the author.
E N D
Presentation Transcript
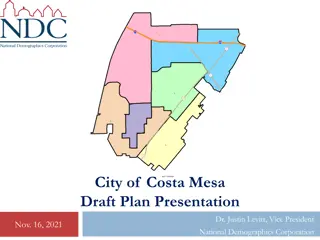
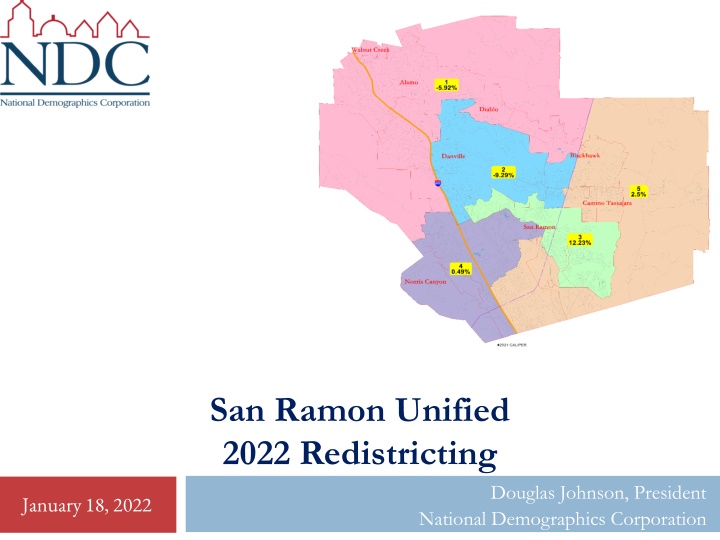
San Ramon Unified 2022 Redistricting Douglas Johnson, President National Demographics Corporation January 18, 2022
Redistricting Rules and Goals Traditional Redistricting Principles Communities of interest Compact Contiguous Visible (Natural & man-made) boundaries Respect voters choices / continuity in office Planned future growth Minimize voters shifted to different election years Preserving the core of existing election areas Federal Laws Equal Population Federal Voting Rights Act No Racial Gerrymandering January 18, 2022 2
Existing Trustee Areas The difference between the smallest and largest must be less than 10%. To balance, at a minimum Area 3 needs to give up population, while Area 2 needs to gain population. January 18, 2022 3
Current Trustee Area Demographics District 1 2 3 4 5 Total District ACS Pop. Est. 1 2 3 4 5 Total Total Pop 30,796 -1938 -5.92% 7.8% 73% 1% 15% 22,210 6% 82% 1% 10% 23,939 5% 5% 7% 1% 86% 1% 21,315 5% 4% 7% 1% 86% 1% 16,355 4% 4% 6% 1% 88% 1% 29,694 -3,040 36,736 4,002 32,893 159 33,553 163,672 819 2.50% 21.51% 10% 44% 2% 41% 18,960 98,680 8% 61% 3% 27% 21,603 106,955 8% 7% 20% 2% 66% 3% 18,920 94,139 8% 7% 20% 2% 67% 3% 13,050 66,361 7% 7% 15% 2% 72% 3% Total age0-19 29,795 24% 44% 32% 15% 70% 85% 4% 6% 6% 30,842 29% 33,942 34% 28,961 28% 29,178 152,717 29% 51% 20% 33% 64% 66% 3% 16% 16% Deviation from ideal 7,042 29% 50% 21% 28% 64% 69% 3% 17% 12% % Deviation % Hisp % NH White -9.29% 12.23% 9% 67% 0.49% 9% 41% Age age20-60 age60plus immigrants 48% 22% 17% 53% 13% 40% 56% 17% 31% 6% 19% 8% 47% 2% 39% Total Pop % NH Black % Asian-American Total 1% 20% 20,941 4% 69% 18,665 3% 44% 17,904 Immigration naturalized english spanish 67% 84% 2% 66% 47% 3% 54% 64% 4% Language spoken at home % Hisp % NH White % NH Black 5% 79% 1% 5% 34% 2% 8% 60% 3% 6% 64% 2% 26% Citizen Voting Age Pop asian-lang other lang Speaks Eng. "Less than Very Well" 8% 7% 33% 18% 19% 13% % Asian/Pac.Isl. Total % Latino est. 14% 22,086 6% 58% 19,526 6% 27% 19,801 9% Language Fluency Education (among those age 25+) 3% 4% 15% 9% 9% 8% 7% 6% 18% 2% 71% 2% hs-grad bachelor graduatedegree 21% 42% 28% 19% 45% 27% 18% 40% 33% 19% 40% 30% 25% 38% 27% 20% 41% 29% Voter Registration (Nov 2020) % Spanish-Surnamed % Asian-Surnamed % Filipino-Surnamed 6% 9% 1% 6% 35% 2% 8% 19% 2% Child in Household Pct of Pop. Age 16+ % NH White est. % NH Black Total 82% 1% 19,771 51% 3% 16,918 67% 3% 17,215 child-under18 29% 41% 59% 40% 50% 44% employed 58% 64% 66% 71% 65% 65% % Latino est. % Spanish-Surnamed % Asian-Surnamed 6% 6% 9% 6% 6% 35% 9% 8% 19% 7% 6% 17% 2% 72% 2% income 0-25k 6% 5% 8% 34% 47% 90% 10% 16% 84% 5% 7% 6% 6% 7% 6% 39% 42% 89% 11% 15% 85% 6% 6% 7% 38% 43% 84% 16% 20% 80% Voter Turnout (Nov 2020) income 25-50k income 50-75k income 75-200k 6% 5% 38% 7% 6% 34% 6% 8% 47% % Filipino-Surnamed % NH White est. % NH Black 1% 82% 1% 2% 51% 3% 2% 68% 3% Household Income income 200k-plus single family multi-family 45% 94% 6% 47% 81% 19% 33% 68% 32% Total 14,845 6% 5% 10,154 6% 6% 11,957 8% 8% % Latino est. % Spanish-Surnamed 6% 6% 14% 1% 76% 2% Housing Stats Voter Turnout (Nov 2018) % Asian-Surnamed % Filipino-Surnamed % NH White est. 8% 1% 84% 31% 2% 56% 15% 2% 72% rented owned 10% 90% 26% 74% 34% 66% % NH Black est. 1% 2% 3% January 18, 2022 4
Minimal Change Option The minimal changes necessary would leave Areas 1, 4 and 5 the same as currently configured, and would make the map significantly more compact. The colors shown in this map would be the adjusted Trustee Areas. Dougherty Valley now has enough population to be its own trustee area. January 18, 2022 5
Min. Changes Map Demographics District 1 2 3 4 5 Total District ACS Pop. Est. 1 2 3 4 5 Total Total Pop 30,796 33,531 32,899 32,893 33,553 163,672 -1938 797 165 -5.92% 2.43% 0.50% 0.49% 2.50% 8.42% 7.80% 9% 6% 73% 66% 14% 1% 1% 4% 15% 21% 74% 22,210 23,892 15,715 17,904 18,960 98,680 6% 5% 5% 82% 79% 27% 1% 1% 3% 10% 15% 64% 23,939 25,152 16,460 19,801 21,603 106,955 5% 6% 7% 5% 6% 6% 7% 10% 39% 1% 1% 3% 86% 82% 45% 1% 1% 4% 21,315 22,522 14,167 17,215 18,920 94,139 5% 6% 6% 4% 6% 6% 7% 10% 39% 1% 1% 3% 86% 82% 45% 1% 1% 4% 16,355 16,993 8,006 11,957 13,050 66,361 4% 5% 7% 4% 5% 7% 6% 8% 37% 1% 1% 3% 88% 84% 48% 1% 1% 3% Total age0-19 age20-60 age60plus immigrants naturalized english spanish asian-lang other lang 29,795 34,699 30,084 28,961 29,178 152,717 24% 28% 36% 44% 47% 55% 32% 24% 10% 15% 18% 43% 70% 67% 67% 85% 82% 44% 4% 2% 3% 6% 8% 35% 6% 8% 18% Deviation from ideal % Deviation % Hisp % NH White % NH Black % Asian-American Total % Hisp % NH White % NH Black % Asian/Pac.Isl. Total % Latino est. % Spanish-Surnamed % Asian-Surnamed % Filipino-Surnamed % NH White est. % NH Black Total % Latino est. % Spanish-Surnamed % Asian-Surnamed % Filipino-Surnamed % NH White est. % NH Black Total % Latino est. % Spanish-Surnamed % Asian-Surnamed % Filipino-Surnamed % NH White est. % NH Black est. 159 819 2,757 28% 56% 17% 31% 54% 64% 4% 19% 13% 29% 51% 20% 33% 64% 66% 3% 16% 16% 29% 50% 21% 28% 64% 69% 3% 17% 12% Age 9% 41% 3% 44% 10% 44% 2% 41% 8% 47% 2% 39% Total Pop Immigration Language spoken at home 8% 60% 3% 27% 8% 61% 3% 27% 6% 64% 2% 26% Citizen Voting Age Pop Language Fluency Education (among those age 25+) Speaks Eng. "Less than Very Well" hs-grad bachelor graduatedegree 3% 4% 16% 9% 9% 8% 9% 8% 19% 2% 67% 3% 8% 7% 20% 2% 66% 3% 7% 6% 18% 2% 71% 2% 21% 42% 28% 21% 44% 27% 16% 41% 34% 19% 40% 30% 25% 38% 27% 20% 41% 29% Voter Registration (Nov 2020) Child in Household Pct of Pop. Age 16+ child-under18 29% 39% 65% 40% 50% 44% employed 58% 62% 68% 71% 65% 65% 9% 8% 19% 2% 68% 3% 8% 7% 20% 2% 67% 3% 7% 6% 17% 2% 72% 2% income 0-25k income 25-50k income 50-75k income 75-200k income 200k-plus single family multi-family rented owned 6% 5% 8% 34% 47% 90% 10% 16% 84% 6% 7% 5% 39% 44% 94% 6% 11% 89% 7% 5% 6% 33% 49% 79% 21% 27% 73% 6% 6% 8% 47% 33% 68% 32% 34% 66% 6% 7% 6% 39% 42% 89% 11% 15% 85% 6% 6% 7% 38% 43% 84% 16% 20% 80% Voter Turnout (Nov 2020) Household Income 8% 8% 15% 2% 72% 3% 7% 7% 15% 2% 72% 3% 6% 6% 14% 1% 76% 2% Voter Turnout (Nov 2018) Housing Stats January 18, 2022 6
Public Input & Discussion Questions? Public Input Direction on Process and Mapping January 18, 2022 7