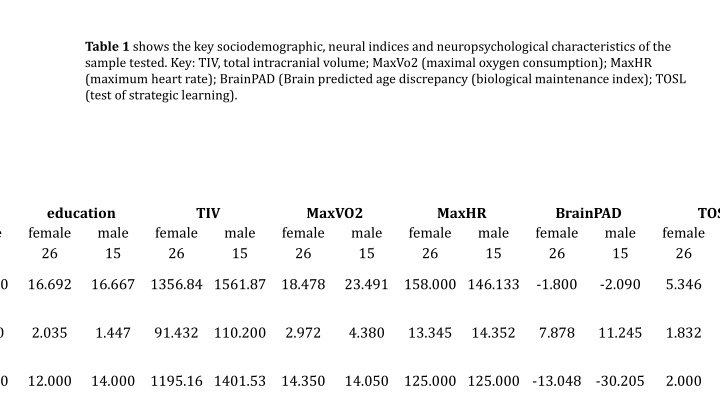
Table 1 presents key sociodemographic, neural indices, and neuropsychological characteristics of the sample tested, including total intracranial volume, maximal oxygen consumption (MaxVo2), maximum heart rate (MaxHR), BrainPAD, and Test of Strategic Learning (TOSL). Table 2 and Table 3 show results from VBM multivariate linear regression analyses exploring the relationship between VO2max and the signal intensity of neuromodulatory subcortical systems, along with Bayesian multiple regression models examining the associations of ROIs in the neuromodulatory subcortical system with VO2max while considering various covariates.
Please find below an Image/Link to download the presentation.
The content on the website is provided AS IS for your information and personal use only. It may not be sold, licensed, or shared on other websites without obtaining consent from the author. If you encounter any issues during the download, it is possible that the publisher has removed the file from their server.
You are allowed to download the files provided on this website for personal or commercial use, subject to the condition that they are used lawfully. All files are the property of their respective owners.
The content on the website is provided AS IS for your information and personal use only. It may not be sold, licensed, or shared on other websites without obtaining consent from the author.
E N D
Presentation Transcript
Table 1 shows the key sociodemographic, neural indices and neuropsychological characteristics of the sample tested. Key: TIV, total intracranial volume; MaxVo2 (maximal oxygen consumption); MaxHR (maximum heart rate); BrainPAD (Brain predicted age discrepancy (biological maintenance index); TOSL (test of strategic learning). education female 26 TIV MaxVO2 female 26 MaxHR BrainPAD female 26 TOSL male 15 male 15 female 26 male 15 male 15 female 26 male 15 male 15 female 26 64.000 16.692 16.667 1356.84 1561.87 18.478 23.491 158.000 146.133 -1.800 -2.090 5.346 4.733 3.140 2.035 1.447 91.432 110.200 2.972 4.380 13.345 14.352 7.878 11.245 1.832 2.374 58.000 12.000 14.000 1195.16 1401.53 14.350 14.050 125.000 125.000 -13.048 -30.205 2.000 1.000
VBM analyses table: Multiple Regression models relating vo2max to signal intensity of neurmodulatory subcortical system Table 2 shows the results for the VBM multivariate linear regression analyses testing the positive relationship between the five ROIs and vo2max. The results across the n.41 healthy subjects are covaried for age, gender, total intracranial volume, education and maximal heart rate (maxHR). The table reports the significant clusters of voxels predicting vo2max values for the statistical threshold of p<0.05. Bayesian Factors (BF10) are reported as parameter of strength in brackets. Cluster of voxels surviving p<0.01 are marked with *. Cluster of voxels surviving p<0.001 are marked with **. No clusters survived multiple comparison corrections (FWE). peak Z scoreb peak T valuea peak cluster Kec p value uncorrd total number of voxels for p<0.05with max BF10g Neuromodulatorysystem side MNI coordinates x FWEe FDRf y Z vo2 max Locus Coeruleus** DorsalRaphe* Median Raphe VentralTegmental Area* Nucleus Basalis of Meynert right 4 0 2 -38 -28 -34 -24 -8 -22 -10 -20 -18 -8 3.72 2.77 2.01 2.61 1.91 3.39 2.61 1.95 2.47 1.86 65 0.000 0.004 0.632 0.446 0.870 1.000 1.000 1.000 1.000 1.000 1.005 1.005 1.005 1.005 1.005 92 (BF10 52.98) 32 (BF10 9.173) 6 (BF10 2.233) 30 (BF10 80.35) 3 (BF10 0.150) / 5 6 3 3 right right left -2 -16 a) Peak T value: T value of the most significant cluster of contiguous voxels b) Peak Z-score: Z-score of the most significant cluster of contiguous voxels c) Peak cluster Ke: number of voxels of the most significant cluster of contiguous voxels d) P value uncorrected e) FWE = family wise error correction value f) FDR = false discovery rate correction value (q) g) Total number of voxels outcoming in the ROI including all clusters of contiguous voxels (in brackets are reported Bayes Factors)
Table 3 reporting the results of the Bayesian multiple regression model investigating the associations between the five ROIs of the neuromodulatory subcortical system and vo2max by covaring for age, gender, education, total intracranial volume and max hearth rate. Bayesian Multiple Regression Model Comparison vo2max and the neuromodulatory subcortical system Models P(M) Null model (incl. age, education, gender, TIV, MaxHR) LC + VTA 0.017 LC + DR + VTA 0.017 DR + VTA 0.017 LC 0.033 VTA 0.033 LC + VTA + NBM 0.017 P(M|data) BFM BF10 R 0.167 8.737e-4 0.004 1.000 0.414 0.162 0.109 0.101 0.082 0.063 0.056 11.381 7.232 6.617 2.596 1.964 3.477 1850.837 1249.826 1154.276 470.274 362.961 637.007 0.661 0.685 0.653 0.604 0.599 0.674 Note. All models include age, education, gender, TIV, MaxHR. Table displays only a subset of models; to see all models, select "No" under "Limit No. Models Shown". Table 3 reporting the results of the Bayesian multiple regression model investigating the associations between the five ROIs of the neuromodulatory subcortical system and vo2max by covaring for age, gender, education, total intracranial volume and max hearth rate.
ANCOVA Locus Coeruleus signal intensity and VO2Max level Cases Sum of Squares df Mean Square F p VO2Max Level 0.011 1 0.011 9.847 0.004 gender 0.001 1 0.001 1.123 0.297 age 6.902e -4 1 6.902e -4 0.599 0.444 education 4.150e -6 1 4.150e -6 0.004 0.953 TIV 0.001 1 0.001 1.067 0.309 MaxHR 4.896e -4 1 4.896e -4 0.425 0.519 Residuals 0.039 34 0.001 Note. Type III Sum of Squares Bootstrapped Post Hoc Comparisons - Vo2Max level 99% bca CI Mean Difference Lower Upper SE bias t Cohen's d p bonf Above 20 0.039 0.014 0.079 0.012 -2.687e -4 3.138 1.212 0.004*** ** p < .01 Note. The model is controlled for the effect of age, gender, education, TIV and maxHR. Note. Mean Difference estimate is based on the median of the bootstrap distribution. Note. Cohen's d does not correct for multiple comparisons. Note. Bootstrapping based on 10000 successful replicates. Note. Results are averaged over the levels of: gender Bias corrected accelerated.
VBM analyses table: Multiple Regression models relating BrainPAD to signal intensity of neurmodulatory subcortical system Supplementary table 1 shows the results for the VBM multivariate linear regression analyses testing the positive relationship between the five ROIs and BrainPAD. The results across the n.41 healthy subjects are covaried for age, gender, total intracranial volume, education. The table reports the significant clusters of voxels predicting BrainPAD values for the statistical threshold of p<0.05. Bayesian Factors (BF10) are reported as parameter of strength in brackets. Cluster of voxels surviving p<0.01 are marked with *. Cluster of voxels surviving p<0.001 are marked with **. No clusters survived multiple comparison corrections (FWE). peak Z scoreb peak T valuea peak cluster Kec p value uncorrd total number of voxels for p<0.05with max BF10g Neuromodulatorysystem side MNI coordinates x FWEe FDRf y Z BrainPAD Locus Coeruleus** DorsalRaphe* MedianRaphe* VentralTegmental Area* Nucleus Basalis of Meynert right right right right right 4 2 2 4 -38 -30 -34 -26 -6 -22 -8 -20 -16 -10 3.72 3.33 2.52 3.62 3.44 3.39 3.08 2.40 3.32 3.17 12 12 0.000 0.001 0.008 0.000 0.001 1.000 1.000 1.000 1.000 1.000 1.005 1.005 1.005 1.005 1.005 140 (BF10 1573.36) 33 (BF10 10.54) 3 (BF10 15.17) 21 (BF10 129.98) 52 (BF10 144.97) 6 5 16 15 a) Peak T value: T value of the most significant cluster of contiguous voxels b) Peak Z-score: Z-score of the most significant cluster of contiguous voxels c) Peak cluster Ke: number of voxels of the most significant cluster of contiguous voxels d) P value uncorrected e) FWE = family wise error correction value f) FDR = false discovery rate correction value (q) g) Total number of voxels outcoming in the ROI including all clusters of contiguous voxels (in brackets are reported Bayes Factors)
VBM analyses table: Multiple Regression models relating TOSL to signal intensity of neurmodulatory subcortical system Supplementary table 2 shows the results for the VBM multivariate linear regression analyses testing the positive relationship between the five ROIs and TOSL. The results across the n.41 healthy subjects are covaried for age, gender, total intracranial volume, education. The table reports the significant clusters of voxels predicting TOSL values for the statistical threshold of p<0.05. Bayesian Factors (BF10) are reported as parameter of strength in brackets. Cluster of voxels surviving p<0.01 are marked with *. Cluster of voxels surviving p<0.001 are marked with **. No clusters survived multiple comparison corrections (FWE). peak Z scoreb peak T valuea peak cluster Kec p value uncorrd total number of voxels for p<0.05with max BF10g Neuromodulatorysystem side MNI coordinates x FWEe FDRf y Z TOSL Locus Coeruleus* DorsalRaphe Median Raphe VentralTegmental Area* Nucleus Basalis of Meynert* left -4 0 2 4 -40 -32 -32 -24 -2 -34 -12 -24 -18 -8 3.14 2.17 2.80 3.29 2.68 3.14 2.09 2.64 3.05 2.54 12 0.002 0.004 0.004 0.001 0.870 1.000 1.000 1.000 1.000 1.000 1.005 1.005 1.005 0.999 1.005 95 (BF10 33.1) 3 (BF10 4.93) 29 (BF10 4.22) 5 (BF10 3.92) 14 (BF10 3.86) / 1 right right left 29 2 3 -22 a) Peak T value: T value of the most significant cluster of contiguous voxels b) Peak Z-score: Z-score of the most significant cluster of contiguous voxels c) Peak cluster Ke: number of voxels of the most significant cluster of contiguous voxels d) P value uncorrected e) FWE = family wise error correction value f) FDR = false discovery rate correction value (q) g) Total number of voxels outcoming in the ROI including all clusters of contiguous voxels (in brackets are reported Bayes Factors)
Direct effects 95% Confidence Interval Estimate Std. Error z-value p Lower Upper MaxVO2 BrainPAD 0.432 0.188 2.298 0.022 0.064 0.800 Note. Delta method standard errors, normal theory confidence intervals, ML estimator. Indirect effects 95% Confidence Interval Lower -0.279 -0.098 -0.099 -0.166 -0.107 Estimate -0.109 0.041 -0.024 -0.034 -0.007 Std. Error 0.087 0.071 0.039 0.067 0.051 z-value -1.261 0.574 -0.613 -0.507 -0.148 p 0.207 0.566 0.540 0.612 0.883 Upper 0.061 0.179 0.052 0.098 0.092 MaxVO2 MaxVO2 MaxVO2 MaxVO2 MaxVO2 LC DR MR VTA NMB BrainPAD BrainPAD BrainPAD BrainPAD BrainPAD Note. Delta method standard errors, normal theory confidence intervals, ML estimator. Total effects 95% Confidence Interval Estimate Std. Error z-value p Lower Upper MaxVO2 BrainPAD 0.298 0.195 1.527 0.127 -0.085 0.680 Note. Delta method standard errors, normal theory confidence intervals, ML estimator. Total indirect effects 95% Confidence Interval Estimate Std. Error z-value p Lower Upper