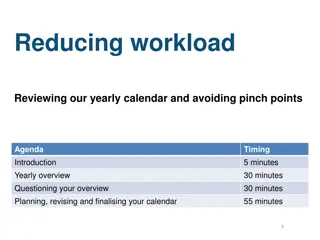
Strategies for Managing Workload in Non-Traditional Settings

Learn effective techniques for boosting productivity in unconventional work environments. Explore tips on time management, prioritization, and task organization to enhance efficiency and achieve your goals efficiently.

Download Presentation

Please find below an Image/Link to download the presentation.
The content on the website is provided AS IS for your information and personal use only. It may not be sold, licensed, or shared on other websites without obtaining consent from the author.If you encounter any issues during the download, it is possible that the publisher has removed the file from their server.
You are allowed to download the files provided on this website for personal or commercial use, subject to the condition that they are used lawfully. All files are the property of their respective owners.
The content on the website is provided AS IS for your information and personal use only. It may not be sold, licensed, or shared on other websites without obtaining consent from the author.
E N D
Presentation Transcript
Board Meeting Q1 2023 Presenter name (s) Date
Whats working: What s not working: Recent or near-term wins Broken processes New processes delivering better than expected Negative developments Product concerns Company achievements New hires Potential Risks
Agenda 01 CEO updates 02 Financials 03 Department updates 04 Discussion
01. CEO UPDATES Strategic Learnings 01 Updates on current market conditions 02 Expected audience size or changes in ICP 03 Forecasted growth for the approaching quarter 04 Changes in product roadmap/headcount planning
01. CEO UPDATES Company Learnings from Q3 01 Company update #1 02 Company update #2 03 Company update #3 04 Company update #4
01. CEO UPDATES Runway
01. CEO UPDATES Growth
01. CEO UPDATES MRR
01. CEO UPDATES Cohorted Retention Month 0 Month 1 Month 2 Month 3 Month 4 Month 5 Month 6 Month 7 Month 8 Month 9 Month 10 Month 11 Month 12 Dec 21 100% 100% 100% 100% 100% 100% 100% 100% 100% 100% 100% 100% 100% Jan 22 100% 99% 96% 93% 109% 109% 101% 107% 107% 107% 107% 108% Feb 22 100% 100% 100% 100% 100% 100% 100% 100% 100% 100% 100% Mar 22 100% 100% 100% 100% 100% 64% 64% 64% 64% 64% Apr 22 100% 100% 100% 100% 100% 100% 100% 100% 93% May 22 100% 100% 100% 100% 100% 100% 100% 100% Jun 22 100% 99% 99% 99% 99% 99% 99% Jul 22 100% 56% 56% 56% 56% 56% Aug 22 100% 235% 275% 183% 103% Sep 22 100% 100% 100% 83% Oct 22 100% 64% 37% Nov 22 100% 13% Dec 22 100% Avg $ Retention 100% 92% 91% 89% 89% 88% 88% 88% 88% 88% 89% 88% 86%
01. CEO UPDATES Engagement Top 10 Customers Users DAU/MAU DAU/WAU Customer 1 240 38% 72% Customer 2 190 39% 67% Customer 3 180 36% 69% Customer 4 180 31% 55% Customer 5 135 30% 63% Customer 6 130 27% 86% Customer 7 125 28% 71% Customer 8 120 42% 60% Customer 9 100 20% 100% Customer 10 90 17% 67%
01. CEO UPDATES Summary KPIs Q1 2021 Q2 2021 Q3 2021 Q4 2021 Q1 2022 New Business ARR 90,000 140,000 160,000 180,000 250,000 Expansion ARR 30,000 50,000 50,000 60,000 85,000 Churn ($) 10,000 0 10,000 20,000 20,000 Net New ARR 110,000 190,000 200,000 220,000 320,000 Total ARR 1,110,000 1,300,000 1,500,000 1,720,000 2,355,000 Burn 330,000 410,000 440,000 505,000 580,000 Burn Multiple 3.0X 2.2X 2.2X 2.3X 1.8X ACV $600 $700 $730 $750 $833 CAC $1,667 $1,600 $1,400 $1,300 $1,150 Payback (Months) 6 5 4 3.5 2.5 Net Dollar Retention 154% 145% 145% 130% 137% Logo Retention 88% 95% 95% 91% 90%
($000s) 2020A Q1 2021A Q2 2021A Q3 2021A Q4 2021A 2021A Q1 2022A Q2 2022E Q3 2022E Q4 2022E 2022E 2023E Net New ARR 0 40 175 205 240 240 955 305 400 450 1,630 4,650 Actual vs projected ARR 60 100 275 480 720 720 1,195 1,500 1,900 2,350 2,350 7,000 KPI financials Revenue 25 60 140 180 220 600 $300 400 520 650 $1,870 5,610 Gross Margin -10% -15% -25% -10% -5% -9% 35% 45% 50% 55% 48% 55% Fundraising expectations OPEX R&D 220 330 495 595 485 1,905 550 500 500 500 2,050 2,700 S&M 100 150 225 330 495 1,200 450 500 550 600 2,100 4,000 G&A 100 150 140 160 200 650 225 220 240 250 935 1,000 Total OPEX 420 630 860 1,085 1,180 3,755 1,225 1,220 1,290 1,350 5,085 7,700 Operating Income -423 -639 -895 -1,103 -1,169 -3,806 -1,120 -1040 -1,030 -993 -4,183 -4,615 Net income -428 -639 -895 -1,103 -1,169 -3,811 -1,125 -1,045 -1.035 -998 -4,188 -4,620 Cash 3,000 2,300 1,550 200 5,500 5,500 4,100 2,900 1,900 1,150 1,150 13,150 Debt 0 0 250 500 500 500 500 500 500 750 1,000 Burn -1,200 -700 -1,000 -1,600 -1,700 -5,000 -1,400 -1,200 -1,000 -1,000 -4,600 -8,000 Capital Raise Debt 0 0 250 250 0 0 0 0 0 250 250 0 Equity 0 0 0 0 7,000 0 0 0 0 0 0 20,000
02. FINANCIALS Headcount
Sales Updates
03. SALES UPDATES KPIs: Last Quarter Q1 2022 DEALS CLOSED Last quarter s new ARR by deals and contract size Account Type Status New ARR Booked Alpha New W 80,000 New business vs. renewals Bravo New W 70,000 Expansion vs. contraction Charlie New W 100,000 Delta New L Eho Expansion W 10,000 Foxtrot Expansion W 20,000 Golf Expansion L Hotel Renewal W 60,000 India Renewal W 50,000 Juliet Renewal L Kilo Contraction L -10,000 Lima Contraction L -10,000 Papa Churn L -20,000
03. SALES UPDATES Bookings
03. SALES UPDATES KPI Pipeline Account Stage Amount Probability Weighted Amount Close Date Alpha Lead $100,000 20% $10,000 Aug 21 Bravo Lead $50,000 20% $7,500 Jul 21 Charlie Lead $75,000 20% $18,750 Jul 21 Delta Lead $150,000 20% $37,500 Jul 21 Echo Qualification $200,000 40% $80,000 Jun 21 Foxtrot Qualification $75,000 40% $30,000 Jun 21 Golf Qualification $150,000 40% $60,000 May 21 Hotel Demo $75,000 60% $45,000 May 21 India Demo $150,000 60% $90,000 May 21 Juliet Negotiation $200,000 80% $160,000 Apr 21 Kilo Negotiation $150,000 80% $120,000 Apr 21 Lima Proposal $120,000 90% $108,000 Apr 21 TOTAL WEIGHTED SALES PIPELINE IN Q2 $1,120,000 $693,000
03. SALES UPDATES Pipeline Generation PIPELINE OVERVIEW Weighted total pipeline ($000s) Stage # of accounts QoQ Change % Interested 1,000 25% n/a Lead 470 30% 400 Qualification 200 40% 600 Demo 80 50% 400 Negotiation 45 60% 300 Proposal 40 40% 250
03. SALES UPDATES Forecast: ARR Forecast Beat Original Plan Missed Original Plan Jan-22 Feb-22 Mar-22 Apr-22 May-22 Jun-22 Jul-22 Aug-22 Sep-22 Oct-22 Nov-22 Dec- 22 Original Plan 700 880 1,200 1,350 1,550 1,720 1,800 1,980 2,100 2,250 2,450 2,660 New Forecast Jan-22 700 880 1,200 1,350 1,550 1,720 1,800 1,980 2,100 2,250 2,450 2,660 Feb-22 890 1,200 1,350 1,600 1,750 1,800 1,980 2,100 2,250 2,450 2,660 Mar-22 1,195 1,350 1,600 1,700 1,780 1,980 2,100 2,250 2,450 2,660 Apr-22 1,350 1,600 1,700 1,800 1,980 2,100 2,250 2,450 2,660 May-22 1,500 1,680 1,800 1,980 2,100 2,250 2,450 2,660 Jun-22 1,650 1,800 1,980 2,100 2,250 2,450 2,660 Jul-22 18,300 1,980 2,100 2,250 2,450 2,660 Aug-22 1,990 2,100 2,250 2,450 2,660 Sep-22 Oct-22 Nov-22 Dec-22
03. SALES UPDATES KPI Pipeline Sales Rep Deals Closed Bookings New ARR Bookings Quota Quota Attained Sales Rep 1 8 $150,000 $75,000 $120,000 125% Sales Rep 2 6 $70,000 $50,000 $60,000 117% Sales Rep 3 7 $110,000 $80,000 $100,000 110% Sales Rep 4 9 $85,000 $50,000 $80,000 106% Sales Rep 5 4 $100,000 $50,000 $100,000 100% Sales Rep 6 3 $180,000 $90,000 $200,000 90% Sales Rep 7 3 $40,000 $40,000 $50,000 80% Sales Rep 8 2 $35,000 $30,000 $50,000 70% Sales Rep 9 2 $60,000 $55,000 $100,000 60% Sales Rep 10 2 $75,000 $65,000 $150,000 50%
Product Updates
03. PRODUCT UPDATES Product Priorities Latest Releases: Impact: Wins Tech improvement #1 Tech improvement #2 Delays Tech improvement #3 Objectives achieved
03. PRODUCT UPDATES Product Roadmap Q1 Q2 Q3 Q4 Jan Feb Mar Apr May Jun July Aug Sep Oct Nov Dec Key feature #1 1 Key feature #2 2 key feature #3 3 Key feature #4 4 Key feature #5 5
03. PRODUCT UPDATES Engagement
03. MARKETING UPDATES Priorities for the quarter 01 Marketing events 02 Campaign review Marketing Milestones 03 New initiatives 04 Current challenges / roadblocks


")