The National Economic Education Delegation
Explore the mission and vision of the National Economic Education Delegation (NEED) led by professional economists to promote understanding of economic policy issues in the United States. Discover available presentation topics, key members, and the nonpartisan nature of NEED's initiatives.
Download Presentation

Please find below an Image/Link to download the presentation.
The content on the website is provided AS IS for your information and personal use only. It may not be sold, licensed, or shared on other websites without obtaining consent from the author. If you encounter any issues during the download, it is possible that the publisher has removed the file from their server.
You are allowed to download the files provided on this website for personal or commercial use, subject to the condition that they are used lawfully. All files are the property of their respective owners.
The content on the website is provided AS IS for your information and personal use only. It may not be sold, licensed, or shared on other websites without obtaining consent from the author.
E N D
Presentation Transcript
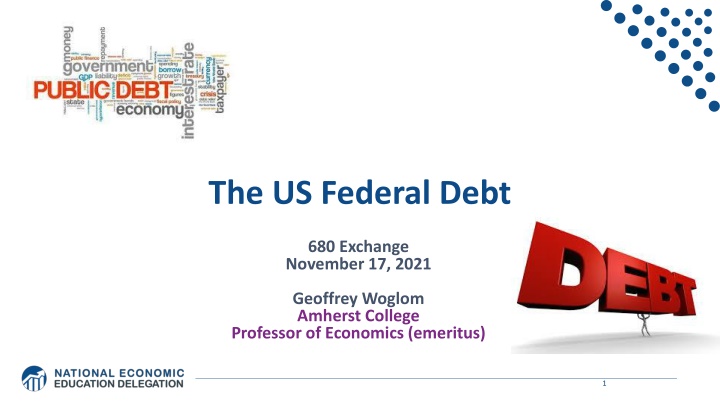
The US Federal Debt 680 Exchange November 17, 2021 Geoffrey Woglom Amherst College Professor of Economics (emeritus) 1
National Economic Education Delegation Vision - One day, the public discussion of policy issues will be grounded in an accurate perception of the underlying economic principles and data. Mission - NEED unites the skills and knowledge of a vast network of professional economists to promote understanding of the economics of policy issues in the United States. NEED Presentations - Are nonpartisan and intended to reflect the consensus of the economics profession. 2
Who Are We? Honorary Board: 54 members - 2 Fed Chairs: Janet Yellen, Ben Bernanke - 1 Secretary of the Treasury: Yellen (D) - 6 Chairs Council of Economic Advisers o Furman (D), Rosen (R), Bernanke (R), Yellen (D), Tyson (D), Goolsbee (D) - 3 Nobel Prize Winners o Akerlof, Smith, Maskin Delegates: 590+ members - At all levels of academia and some in government service - All have a Ph.D. in economics - Crowdsource slide decks - Give presentations Global Partners: 45 Ph.D. Economists - Aid in slide deck development 3
Available NEED Topics Include: US Economy Immigration Economics Climate Change Housing Policy Economic Inequality Federal Budgets Economic Mobility Federal Debt US Social Policy 2017 Tax Law Trade and Globalization Autonomous Vehicles Trade Wars 4
Credits and Disclaimer This slide deck was authored by: - Jon Haveman, Executive Director, NEED - Geoffrey Woglom, Amherst College, Emeritus Disclaimer - NEED presentations are designed to be nonpartisan. - It is, however, inevitable that the presenter will be asked for and will provide their own views. - Such views are those of the presenter and not necessarily those of the National Economic Education Delegation (NEED). 5
National Economic Education Delegation Vision - One day, the public discussion of policy issues will be grounded in an accurate perception of the underlying economic principles and data. Mission - NEED unites the skills and knowledge of a vast network of professional economists to promote understanding of the economics of policy issues in the United States. NEED Presentations - Are nonpartisan and intended to reflect the consensus of the economics profession. 6
Who Are We? Honorary Board: 54 members - 2 Fed Chairs: Janet Yellen, Ben Bernanke - 6 Chairs Council of Economic Advisers o Furman (D), Rosen (R), Bernanke (R), Yellen (D), Tyson (D), Goolsbee (D) - 3 Nobel Prize Winners o Akerlof, Smith, Maskin Delegates: 600+ members - At all levels of academia and some in government service - All have a Ph.D. in economics - Crowdsource slide decks - Give presentations Global Partners: 44 Ph.D. Economists - Aid in slide deck development 7
Available NEED Topics Include: Coronavirus Economics Immigration Economics US Economy Housing Policy Climate Change Federal Budgets Economic Inequality Federal Debt Economic Mobility Black-White Wealth Gap Trade and Globalization Autonomous Vehicles Minimum Wages US Monetary Policy 9
Credits and Disclaimer This slide deck was authored by: - Geoffrey Woglom, Amherst College, emeritus This slide deck was reviewed by: - Jon Haveman Disclaimer - NEED presentations are designed to be nonpartisan. - It is, however, inevitable that the presenter will be asked for and will provide their own views. - Such views are those of the presenter and not necessarily those of the National Economic Education Delegation (NEED). 10
The Federal Budget in 2020 Programmatic Outlays less Equals Deficit $3.2 Trillion 15% of GDP 11 Source: CBO, 4/30/2021
Fiscal 2021 (no fancy graphics yet) Deficit, 2.8t (12.4% of GDP) =Outlays, 6.8t Receipts, 4.0t $250b more outlays; $600b more in taxes. 12
Past and Future of Deficits Useful Deficit Decompositions: Total Deficit= (Spending on Programs + Interest Expense)-Revenue =(Programmatic Outlays Revenue)+Interest Expense =Primary Deficit + Net Interest 13 Source: CBO, Updated Budget and Econo9mic Projections, 7/15/2021
Debt vs. Deficit The Sum of All Past Deficits Less Surpluses Equals the Debt Blue Line Debt; Red Line Deficit Shaded areas are recessions 15
A Breakdown of the Total Federal Debt Publicly Held Debt, 9/30/, $22.3 tr Total Public Debt, 9/30, $28.4 tr 24% 22% 42% 34% 78% Publicly Held Intra-gov't Domestically Held Foreign Federal Reserve 16 Sources: US Treasury, Federal Reserve Board
Not All Debt Is Created Equal Intra-governmental debt is important bookkeeping. - This debt DOES NOT require funding on credit markets Debt held by the public - This debt is funded by borrowing on credit markets and competes with private funding. Most analyses focus on the publicly debt relative to GDP because: - To the extent that debt and deficits have burdens these burdens depend on the size of the debt relative to the size of the economy. 17
CBO: Budget Analysts in Chief The Congressional Budget Office was founded in 1974 to provide Congress with information about the budgetary implications of legislation. Two kinds of Reports - Cost Estimates H.R. 486 Ukraine Religious Freedom Support Act - Build Back Better Scoring this Friday! - Projections of Debt and Deficits The Budget and Economic Outlook: 2020 to 2030 19
Key Points About the U.S. Relative Debt 1946-1974 1. Relative debt peaked during WWII (106%) - followed by a steady decline until the 1980s. 2. Prior to 1983, relative debt rose purposefully (wars, recessions, public investment) and then fell. 3. What can we learn from the 46-74 period, where the relative debt fell continuously? 20
Debt Dynamics The relative debt fell in spite of deficits in 21 of the 29 years, with the debt increasing by 42%. How? 1946-1974, deficits caused the debt to grow, but not as fast as the economy was growing. While the debt grew by 42%, GDP (nominal) grew by 550% You don t need a surplus to reduce the relative debt 21
Traditional Views of the Cost of the Debt First a non-issue: There is no analogy between household and government debt. - The government does not have to pay back the debt. - Retirees cash in maturing bonds which are financed with new bond issues sold to younger people. - Interest on the debt is essentially paid by the young to their parents Economist View of the Debt circa 1980, very little cost because relative debt was falling. That changes in 1983. 22
Traditional View: Debt and Deficits Raise Interest Rates 1. Crowding Out: Higher interest rates lead to less investment and over time to a smaller capital stock and reduced future output. 2. Foreign Borrowing: Higher interest rates lead to foreign capital inflows or foreign borrowing. With foreign borrowing, some of our GDP is paid to foreigners as interest. 23
The Dog that Didnt Bark; Rising Interest Rates? Blue Line Debt; Red Line Rate on 10-Yr Treasury yesterday, 10-yr: 1.63% 24
Olivier Blanchards Presidential Address to the AEA 1/2019 If the future is like the past [with low interest rates], the issuance of debt without a later increase in taxes may well be feasible. Put bluntly, public debt may have no fiscal cost. But, My purpose is not to argue for more public debt, especially in the current political environment. It is to have a richer discussion of the costs of debt than is currently the case. 25
What the Traditional View Got Wrong The growth rate in debt : - One part of the debt grows at the interest rate. - Total debt grows by more than the interest rate when there is a primary deficit. The traditional view assumes that the interest rate on debt is greater than the growth rate of GDP - So, there must be a primary surplusto offset the interest rate - i.e., programmatic outlays must be less than revenues to stabilize the debt. 26
An Almost Free Lunch If the interest rate is less than the growth rate of GDP, then Debt to GDP can be stabilized with a (small) primary deficit: programmatic outlays can be less than revenues! Blanchard does believe that the relative debt must be stabilized 1. At some point deficits must be reduced. 2. But it may not be crucial at what level of debt we stabilize. 27
Blanchards Evidence Blue: Rate on 10-Yr Treasury; Red: GDP Growth Except for recessions, interest rates have been less than GDP growth But, why have interest rates fallen and how long will low rates continue? Sadly, we don t know the answer to either question 28
But why must the relative debt be stabilized For practical purposes, the US cannot default on its debt, but International investors, however, can still lose if the exchange value of the dollar falls. Remember, foreign holdings of the public debt amount to almost one-third of the total. 29
Why do Foreigners Buy US Treasuries? Market for Treasuries is the deepest, the most liquid and safest capital market in the world. What would happen if foreigners lost confidence in the stability of the dollar? CBO, The 2020 Long-Term Budget Outlook, 9/2020 The risk of a fiscal crisis appears to be low in the short run despite the higher deficits and debt stemming from the pandemic . Nonetheless, the much higher debt over time would raise the risk of a fiscal crisis in the years ahead. 30
What would a Fiscal Crisis Look Like? Foreigners lose confidence in the dollar and sell Treasuries in exchange for assets denominated in their own currency, 1. Sale of Treasuries raises interest rates, worsening our fiscal outlook. 2. Trading of Foreign for US assets lowers US exchange rate. Raising the price of imports thereby increasing inflation. Lowering the foreign currency returns on all US assets, exacerbating 1. a. b. Could the Fed Bail us Out? 1. It could buy Treasuries and prevent the rise in interest rates. 2. Insufficient foreign assets to prevent the fall in the exchange rate, 31
Bottom Line: We Need to Worry about the Debt 1. Interest rates may not stay this low forever. 2. A fiscal crisis should be avoided at all costs. 3. The good news is we may be able to stabilize the relative debt without a running a surplus. 32
We Have a Little Time: CBOs Crystal Ball But, it won t be easy 35
What about Infrastructure and BBB? Infrastructure $1.2t - terrible reporting - Net New Spending $415b over 10 years. Build Back Better: CBO this Friday - Joint Committee on Taxation (11/4/21) estimates that the $1.7 trillion is spending is paid for on 10 years - Problem: spending is equally spread; tax increases occur in the last 5 years. 36
Thank you! Any Questions? www.NEEDelegation.org <Geoffrey Woglom> <grwoglom@amherst.edu> Contact NEED: Info@NEEDelegation.org Submit a testimonial: www.NEEDelegation.org/testimonials.php Support NEED: www.NEEDelegation.org/donate.php 37


