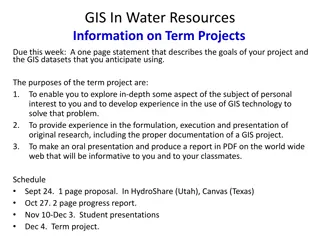
Thematic Mapping in GIS: Basics and Applications
Learn the fundamentals of thematic mapping in GIS, including its definition, GIS technology overview, learning objectives, ArcMap basics, data downloading, and getting started tips. Explore how thematic maps help visualize and analyze spatial data effectively.

Download Presentation

Please find below an Image/Link to download the presentation.
The content on the website is provided AS IS for your information and personal use only. It may not be sold, licensed, or shared on other websites without obtaining consent from the author. If you encounter any issues during the download, it is possible that the publisher has removed the file from their server.
You are allowed to download the files provided on this website for personal or commercial use, subject to the condition that they are used lawfully. All files are the property of their respective owners.
The content on the website is provided AS IS for your information and personal use only. It may not be sold, licensed, or shared on other websites without obtaining consent from the author.
E N D
Presentation Transcript
Basics of thematic maps in GIS (ArcMap) Kelly Clonts Presentation for UC Berkeley, D-Lab April 1, 2014
What is thematic mapping? Wikipedia: A thematic map is a type of map or chart especially designed to show a particular theme connected with a specific geographic area. These maps "can portray physical, social, political, cultural, economic, sociological, agricultural, or any other aspects of a city, state, region, nation, or continent".
What is GIS? A geographic information system (GIS) lets us visualize, question, analyze, interpret, and understand data to reveal relationships, patterns, and trends. A computer tool for making maps? (sure, today) Used for complex environmental research (example: flood risk) Provides real world geographic information: location, attributes, spatial relationships (shape)
Learning Objectives Feel comfortable with basic GIS skills Understand basics of file types Be able to use the basic tools Import excel data and shape files Join and relate data Map and visualize data
ArcMap Basics of spatial data Shapefiles (.shp) 1. geographic shapes 2. Projection (coordinate system, transformations) 3. Spreadsheet (attribute data) Kinds of spatial data Polygons Lines points
Getting Started Download data Download Dlab_data 1 excel file 2 shape files Make sure files are extracted and in an easy-to- find location Start ArcMap Start menu All Programs ArcMap10.1
Getting Started: add data Add data to your empty map Click on the icon Link your file folder Add shapefiles: bayarea_tract2000.shp bayarea_general.shp
Basic Tools View data in shapefile Toolbars: Customize>Toolbars Check the projection (Properties> Source) The toolbar: zoom in/out, move, select, information, measure options and more
Basic Tools Explore toolbars Layout vs. data view Table of Contents layers in List by Drawing Order, List by Source, List by Visibility and List by Selection . Zoom: mouse, zoom toolbar, and right click Customize>ArcMap Options (for changing mouse zoom) To measure, click the ruler, then click your map. Options to change units will appear
Basic Tools Table of Contents layers in List by Drawing Order, List by Source, List by Visibility and List by Selection . Layers on bottom = below / top = above Selecting only one layer at a time
Basic Tools Change colors of bayarea_general so that land is hollow and water is blue. Right click> Properites > Symbology > Categories> Add All Values Double click on color icons Click okay and arrange your layers accordingly
Data from FactFinder2 The data displayed in ALAMEDASF.xls were downloaded from American Fact Finder 2. The process: Get your data from Fact Finder 2. Download the data into Excel. Open the Excel file. Whatever format your data comes in, you need to make sure you have a field (column) that includes the tract numbers as a unique identifier. Correct Column names
Joining Data Add labels Right click > Properties > Labels > tract ID#s Join Data Common Problems (naming, file specifics) Add AlamedaSF$ excel file Right click > Joins & Relates > Join
Joining Data Add labels Right click > Properties > Labels > tract ID#s Join Data Common Problems (naming, file specifics) Add AlamedaSF$ excel file Right click > Joins & Relates > Join
Thematic Maps 1. Make sure data is properly joined 2. Properties > Symbology > Quantities (note: categorical data is for categories, such as land use ) 3. 4. Select value (MedYrBuilt, MedTenancy, MedRent, HomeValue) Experiment with changing quantile breaks/labeling - equal interval (3-6%, 6-9%, 9-12%) - Defined interval (define your own) - Quantile (each class has an equal number) - natural breaks (groupings inherent in the data, if there are clumps ) - Edit labels so they make more sense
Displaying Maps After you have chosen data, quantity interval, and changed labels Change to Layout View, add: A clear and readable legend A scale bar A north arrow A title Data source
Resources GIS help: http://resources.arcgis.com/ Demographic data by tract: Factfinder2 Online mapping tools Social Explorer - you can use this to QUICKLY map census and ACS data at the tract level, as well as data from a couple other data sets (religion!): www.socialexplorer.com/pub/maps/home.aspx NY Times, Mapping America: Every City, Every Block this QUICKLY shows mapped 2005-2009 ACS data at the tract level, using several different visual representations: projects.nytimes.com/census/2010/explorer
Resources California Government atlas.ca.gov ceres.ca.gov atlas.resources.ca.gov www.consrv.ca.gov/DLRP/fmmp gis.abag.ca.gov www.scag.ca.gov/mappingGIS.htm www.sandag.org/index.asp www.sfgov.org/site/gis_index.asp?id=371 www.sanjoseca.gov/gis/ GIS Community data.geocomm.com/catalog/index.html http://www.esri.com/data/free- data/index.html Universities www- sul.stanford.edu/depts/gis/web.html issrweb.asu.edu/research_services/gis www.ciesin.columbia.edu/download_data .html Useful sites for downloading free spatial data www.mtc.ca.gov/maps_and_data/GIS/dat a.htm US Federal Government www.census.gov/geo/www/tiger/tgrshp 2010/tgrshp2010.html www.data.gov www.nationalatlas.gov/maplayers.html www.nationalmap.gov msc.fema.gov www.nrcs.usda.gov/Technical/NRI datagateway.nrcs.usda.gov cumulus.cr.usgs.gov www.usgs.gov/ngpo/