Understanding Compression Testing in Material Science
Compression testing involves subjecting specimens to compressive forces to determine properties like compressive strength, stress-strain behavior, and deformation modes. The test is crucial for evaluating the performance of materials in various applications.

Download Presentation

Please find below an Image/Link to download the presentation.
The content on the website is provided AS IS for your information and personal use only. It may not be sold, licensed, or shared on other websites without obtaining consent from the author.If you encounter any issues during the download, it is possible that the publisher has removed the file from their server.
You are allowed to download the files provided on this website for personal or commercial use, subject to the condition that they are used lawfully. All files are the property of their respective owners.
The content on the website is provided AS IS for your information and personal use only. It may not be sold, licensed, or shared on other websites without obtaining consent from the author.
E N D
Presentation Transcript
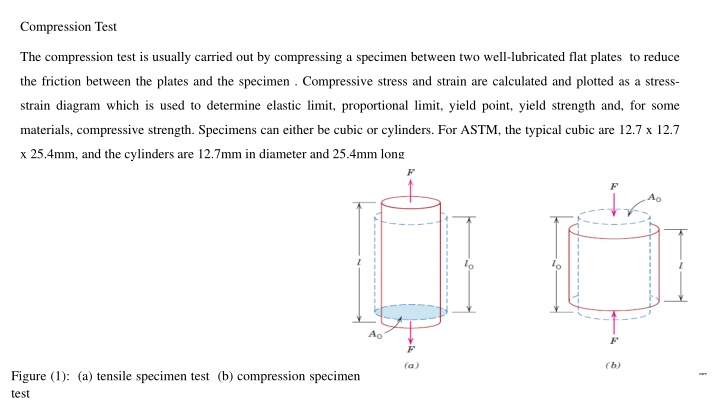
Compression Test The compression test is usually carried out by compressing a specimen between two well-lubricated flat plates to reduce the friction between the plates and the specimen . Compressive stress and strain are calculated and plotted as a stress- strain diagram which is used to determine elastic limit, proportional limit, yield point, yield strength and, for some materials, compressive strength. Specimens can either be cubic or cylinders. For ASTM, the typical cubic are 12.7 x 12.7 x 25.4mm, and the cylinders are 12.7mm in diameter and 25.4mm long Figure (1): (a) tensile specimen test (b) compression specimen test
Figure (2) : stress-strain behavior under compression Compressive strength = - (maximum compressive load ) minimum cross-sectional area Compressive strength is negative due to the atoms under compressive force is moving against each other. Compressive modulus (E) = change in stress change in strain Compression strain ( ) = -(L - L / L )
Brittle materials, such as cast iron and concrete, are often weak in tension because of the presence of submicroscopic cracks and faults. However, these materials can prove to be quite strong in compression, due to the fact that the compression test tends to increase the cross sectional areas of specimens, preventing necking to occur. In general, the average compressive strength to tensile strength ratio of brittle materials is around 8/1. Figure (3) stress-strain behavior of concrete under tension and compression 4
For brittle materials, the compressive strength is relatively easy to obtain, showing marked failure. However, for ductile materials, the compressive strength is generally based on an arbitrary deformation value. Ductile materials do not exhibit the sudden fractures that brittle materials present. They tend to buckle and "barrel out. Figure -5- Stress-strain curve for ductile materials under compressive force
Modes of Deformation in Compression Testing The figure below illustrates the modes of deformation in compression testing. (a) Buckling, when L/D > 5. (b) Shearing, when L/D > 2.5. (c) Double barreling, when L/D > 2.0 and friction is present at the contact surfaces. (d) Barreling, when L/D < 2.0 and friction is present at the contact surfaces. (e) Homogenous compression, when L/D < 2.0 and no friction is present at the contact surfaces. (f) Compressive instability due to work-softening material. Figure -8- deformation modes under compression
Poissons Ratio When a material is compressed in one direction, it usually tends to expand in the other two directions perpendicular to the direction of compression. This phenomenon is called the Poisson effect. Poisson's ratio is a measure of this effect. The Poisson ratio is the fraction (or percent) of expansion divided by the fraction (or percent) of compression, for small values of these changes. Conversely, if the material is stretched rather than compressed, it usually tends to contract in the directions transverse to the direction of stretching. It is a common observation when a rubber band is stretched, it becomes noticeably thinner. Again, the Poisson ratio will be the ratio of relative contraction to relative expansion and will have the same value as above.
For isotropic materials, shear and elastic moduli are related to each other and to Poissons ratio according to E = 2G (1+ ) isotropic material means a material having identical values of a property in all directions. Glass and metals are examples of isotropic materials. For many metals and other alloys, values of Poisson s ratio range between 0.25 and 0.35.
Example: A cylindrical specimen of a hypothetical metal alloy is stressed in compression. If its original and final diameters are 20.000 and 20.025 mm, respectively, and its final length is 74.96 mm, compute its original length if the deformation is totally elastic. Take Poisson s ratio = 0.322 Solution: 2 = ? 20?? =20.025?? 20?? = 1.25 x 10⁻³ ?0 = - 2 1 =?? ?? = 1=-(1.25x10⁻³ / 0.322) = - 3.88x10⁻³ ?? 1+ 1 1 74.96?? 1 3.88x10 >>>> Li = >>>>> Li = 3 ?? Li = 75.25 mm

 : stress-strain behavior under compression")