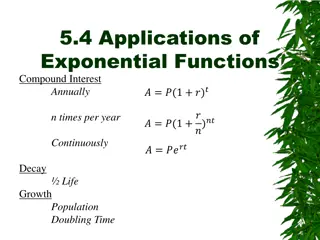
Explore the concepts of exponential functions, their graphical representations, laws of exponents, solving equations, and practical applications. Learn how different bases affect the growth rate and the impact of negative signs on graphs.
Please find below an Image/Link to download the presentation.
The content on the website is provided AS IS for your information and personal use only. It may not be sold, licensed, or shared on other websites without obtaining consent from the author. If you encounter any issues during the download, it is possible that the publisher has removed the file from their server.
You are allowed to download the files provided on this website for personal or commercial use, subject to the condition that they are used lawfully. All files are the property of their respective owners.
The content on the website is provided AS IS for your information and personal use only. It may not be sold, licensed, or shared on other websites without obtaining consent from the author.
E N D
Presentation Transcript
Exponential Functions are functions which can be represented by graphs similar to the graph on the right
All base exponential functions are similar because they all go through the point (0,1), regardless of the size of their base number Exponential Functions are written in the form: y = abx a= constant b = base x = variable
When working with exponential equations, the Laws of Exponents still hold true = 3 3 + + 1 + = = 1 1 13 2 3 9 When solving exponential equations, it is important to have both sides of the equation set to the same base =125 25x = 5 5 2x ( ) 5 =3 x = 5 . 1 = 2 3 5 x 2 3 x
As you could see in the graph, the larger the base, the faster the function increased If we place a negative sign in front of the x, the graphs will be reflected(flipped) across the y-axis
By using Microsoft Excel, we can make a table of values and a graph of the data y = ex X-Value Y-Value -5 -4 -3 -2 -1 0 1 2 3 4 5 160.00 0.01 0.02 0.05 0.14 0.37 1.00 2.72 7.39 20.09 54.60 148.41 140.00 120.00 100.00 80.00 60.00 40.00 20.00 0.00
This powerpoint was kindly donated to www.worldofteaching.com http://www.worldofteaching.com is home to over a thousand powerpoints submitted by teachers. This is a completely free site and requires no registration. Please visit and I hope it will help in your teaching.