Understanding Normal Distribution: Properties, Examples, and Conclusion
Explore the normal distribution, also known as the Gaussian distribution, its properties, examples, limitations, and conclusion. Learn how data near the mean are more frequent, with insights into the Central Limit Theorem and the significance of this distribution in statistical analyses.

Uploaded on | 4 Views
Download Presentation

Please find below an Image/Link to download the presentation.
The content on the website is provided AS IS for your information and personal use only. It may not be sold, licensed, or shared on other websites without obtaining consent from the author. If you encounter any issues during the download, it is possible that the publisher has removed the file from their server.
You are allowed to download the files provided on this website for personal or commercial use, subject to the condition that they are used lawfully. All files are the property of their respective owners.
The content on the website is provided AS IS for your information and personal use only. It may not be sold, licensed, or shared on other websites without obtaining consent from the author.
E N D
Presentation Transcript
StudyMafia.Org Normal Distribution Submitted Studymafia.org Studymafia.org Submitted To: To: Submitted Submitted By: By: Studymafia.org Studymafia.org
Table Contents Definition Introduction Understanding Normal Distribution Properties of Normal Distribution Examples of Normal Distribution Limitations of Normal Distribution Conclusion 2
Definition Normal distribution, also known as the Gaussian distribution, is a probability distribution that is symmetric about the mean, showing that data near the mean are more frequent in occurrence than data far from the mean. 3
Introduction The normal distribution is the proper term for a probability bell curve. In a normal distribution the mean is zero and the standard deviation is 1. It has zero skew and a kurtosis of 3. Normal distributions are symmetrical, but not all symmetrical distributions are normal. Many naturally-occurring phenomena tend to approximate the normal distribution. 4
Understanding Normal Distribution The normal distribution is the most common type of distribution assumed in technical stock market analysis and in other types of statistical analyses. The standard normal distribution has two parameters: the mean and the standard deviation. 6
Understanding Normal Distribution The normal distribution model is important in statistics and is key to the Central Limit Theorem (CLT). This theory states that averages calculated from independent, identically distributed random variables have approximately normal distributions, regardless of the type of distribution from which the variables are sampled (provided it has finite variance). 7
Understanding Normal Distribution The normal distribution is technically known as the Gaussian distribution, however it took on the terminology "normal" following scientific publications in the 19th century showing that many natural phenomena appeared to "deviate normally" from the mean. 8
Understanding Normal Distribution The normal distribution is one type of symmetrical distribution. Symmetrical distributions occur when where a dividing line produces two mirror images. Not all symmetrical distributions are normal, since some data could appear as two humps or a series of hills in addition to the bell curve that indicates a normal distribution. 9
Properties of Normal Distribution First, its mean (average), median (midpoint), and mode (most frequent observation) are all equal to one another. Moreover, these values all represent the peak, or highest point, of the distribution. The distribution then falls symmetrically around the mean, the width of which is defined by the standard deviation. 10
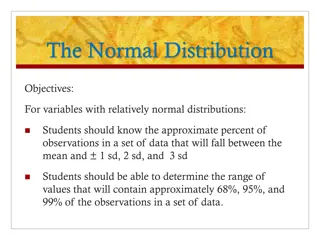
Properties of Normal Distribution The Empirical Rule For all normal distributions, 68.2% of the observations will appear within plus or minus one standard deviation of the mean; 95.4% of the observations will fall within +/- two standard deviations; and 99.7% within +/- three standard deviations. 11
Properties of Normal Distribution Skewness Skewness measures the degree of symmetry of a distribution. The normal distribution is symmetric and has a skewness of zero. 12
Properties of Normal Distribution Kurtosis Kurtosis measures the thickness of the tail ends of a distribution in relation to the tails of a distribution. The normal distribution has a kurtosis equal to 3.0. 13
Properties of Normal Distribution The Formula for the Normal Distribution x = value of the variable or data being examined and f(x) the probability function = the mean = the standard deviation 14
Example of a Normal Distribution Many naturally-occurring phenomena appear to be normally-distributed. Take, for example, the distribution of the heights of human beings. The average height is found to be roughly 175 cm (5' 9"), counting both males and females. 15
Example of a Normal Distribution As the chart below shows, most people conform to that average. Meanwhile, taller and shorter people exist, but with decreasing frequency in the population. According to the empirical rule, 99.7% of all people will fall with +/- three standard deviations of the mean, or between 154 cm (5' 0") and 196 cm (6' 5"). 16
Limitations of Normal Distribution Although the normal distribution is an extremely important statistical concept, its applications in finance can be limited because financial phenomena such as expected stock-market returns do not fall neatly within a normal distribution. In fact, prices tend to follow more of a log- normal distribution that is right-skewed and with fatter tails. 17
Limitations of Normal Distribution Therefore, relying too heavily on a bell curve when making predictions about these events can lead to unreliable results. Although most analysts are well aware of this limitation, it is relatively difficult to overcome this shortcoming because it is often unclear which statistical distribution to use as an alternative. 18
Conclusion A normal distribution is an arrangement of a data set in which most values cluster in the middle of the range and the rest taper off symmetrically toward either extreme. 19
Google.com Wikipedia.org Studymafia.org Slidespanda.com