Understanding Phase Classification and Population Estimations
Explore the relationship between phase classification and population estimates, emphasizing the importance of using the 20% rule and considering a holistic approach with both supporting and contradictory evidence. The process involves analyzing phase descriptions, estimating populations based on various factors, and practical considerations like using cheat sheets for more accurate estimations. Additionally, the impact of malnutrition, mortality, and key drivers on population estimations is discussed, highlighting the need for careful consideration and evidence-based support.

Download Presentation

Please find below an Image/Link to download the presentation.
The content on the website is provided AS IS for your information and personal use only. It may not be sold, licensed, or shared on other websites without obtaining consent from the author. If you encounter any issues during the download, it is possible that the publisher has removed the file from their server.
You are allowed to download the files provided on this website for personal or commercial use, subject to the condition that they are used lawfully. All files are the property of their respective owners.
The content on the website is provided AS IS for your information and personal use only. It may not be sold, licensed, or shared on other websites without obtaining consent from the author.
E N D
Presentation Transcript
Phase classification Phase classification goes hand in hand with population estimates: use of the 20% rule Whole body of evidence brought together for classification , including supporting and contradictory evidence
Phase classification Analysts should always refer to Phase descriptions to cross-check that the situation in the area matches the description of the selected Phase if this is not the case the classification should be reviewed
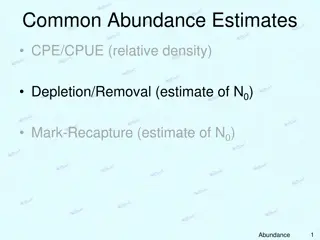
Estimating populations Typically, the most difficult part of the analysis recommended to go through it in plenary Although outcomes are more useful to estimate populations, inference from contributing factors and trend analysis are also important. Analysis of specific household groups also supports population estimations
Practical considerations Indicator table / so called cheat-sheet a useful tool for estimating populations Example from urban analysis in Haiti:
How about malnutrition and mortality? Population estimations are primarily based on food consumption and livelihood change Evidence on acute malnutrition and mortality are used to support/contradict classification - not to override it Nutritional status Mortality Livelihood change Food consumption
Summary justification Food dimensions Key drivers Example of a well articulated conclusion statement Aruna has been classified in Phase 3 Crisis for the April July period. The key drivers of the situation are prolonged dry season and low purchasing power of the population due to high reliance on subsistence agriculture as the main livelihood. Due to the prolonged dry season estimated 40% of households have run out of their food stocks and are now using unsustainable livelihood coping mechanisms, such as sale of productive assets in order to afford to buy food at prices that are 50% higher than usual at this time of the year. 35% of households are using food coping (rCSI >19) and 48% have borderline or poor Food Consumption Score. The most affected are those with small plots who have already run of stocks, and casual labourers who are totally dependent on market for their food needs. Most affected household groups Outcomes 7