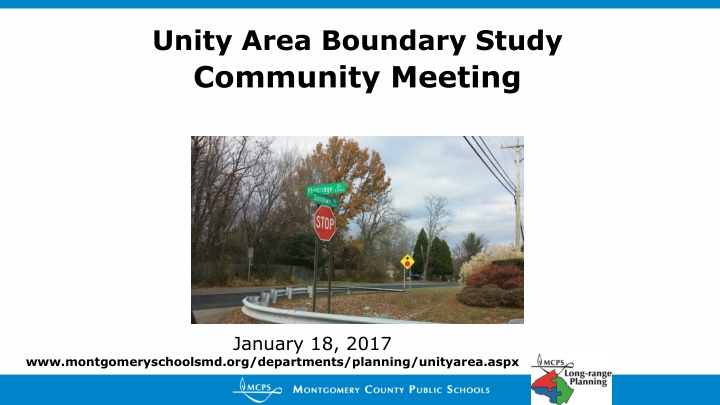
Unity Area Boundary Study Community Meeting
This document provides information on the Unity Area Boundary Study Community Meeting held on January 18, 2017, including agendas, ground rules, enrollment and capacity data for Laytonsville ES and Greenwood ES, demographics impact, and Gaithersburg MS data.

Download Presentation

Please find below an Image/Link to download the presentation.
The content on the website is provided AS IS for your information and personal use only. It may not be sold, licensed, or shared on other websites without obtaining consent from the author.If you encounter any issues during the download, it is possible that the publisher has removed the file from their server.
You are allowed to download the files provided on this website for personal or commercial use, subject to the condition that they are used lawfully. All files are the property of their respective owners.
The content on the website is provided AS IS for your information and personal use only. It may not be sold, licensed, or shared on other websites without obtaining consent from the author.
E N D
Presentation Transcript
Unity Area Boundary Study Community Meeting January 18, 2017 www.montgomeryschoolsmd.org/departments/planning/unityarea.aspx
Agenda Sign in I will call on people in order Ground Rules Review Option
Ground Rules 1. Be true to the charge 2. Share openly 3. Participate enthusiastically 4. Give and receive constructive feedback 5. Appreciate everyone s ideas 6. Suspend judgment 7. Limit discussions to the topic 8. Do homework and be prepared 9. Abide by decisions made by the facilitator 10.Cell phones turn off, vibrate, or answer on first ring 11.Start and end meetings on time 3
Laytonsville ES Enrollment and Capacity (Maximum # of Seats=449) 2017 18 2018 19 No Change 376 84% 2019 20 2020 21 2021 22 2022 23 370 82% 79 313 70% 136 382 85% 67 374 83% 75 390 87% 59 Number of Students % of Building Occupied 73 Available Seats With Change 366 82% 360 80% 89 303 67% 146 372 83% 77 364 81% 85 380 85% 69 Number of Students % of Building Occupied 83 Available Seats 5
Greenwood ES Enrollment and Capacity (Maximum # of Seats=584) 2017 18 2018 19 No Change 450 77% 134 With Change 460 79% 124 2019 20 2020 21 2021 22 2022 23 462 79% 122 443 76% 141 450 77% 134 447 77% 137 432 74% 152 Number of Students % of Building Occupied Available Seats 472 81% 112 453 79% 131 460 79% 124 457 78% 127 442 76% 142 Number of Students % of Building Occupied Available Seats 6
Effect on Demographics % Afr. Amer. % 2 or More School % Asian % Hispanic No Change 20.9% With Change % White % FARMS % ESOL Laytonsville ES 15.7% 7.1% 47.9% 8.4% 20.8% 5.2% Laytonsville ES 16.0% 7.2% 21.1% No Change 7.8% With Change 7.9% 47.5% 8.3% 21.4% 5.6% Greenwood ES 10.4% 7.8% 66.7% 7.4% 9.1% <5.0% Greenwood ES 10.3% 7.7% 66.7% 7.5% 8.9% <5.0% 7
Gaithersburg MS Enrollment and Capacity (Maximum # of Seats=962) 2017 18 2018 19 No Change 857 89% 105 With Change 847 88% 2019 20 2020 21 2021 22 2022 23 816 85% 146 865 90% 97 901 94% 61 959 957 99% Number of Students 100% % of Building Occupied 3 5 Available Seats 806 84% 156 855 89% 107 891 93% 71 949 99% 13 947 98% 15 Number of Students % of Building Occupied 115 Available Seats 8
Rosa Parks MS Enrollment and Capacity (Maximum # of Seats=978) 2017 18 2018 19 No Change 836 85% 142 With Change 846 87% 132 2019 20 2020 21 2021 22 2022 23 862 88% 116 851 87% 127 830 85% 148 824 84% 154 812 83% 166 Number of Students % of Building Occupied Available Seats 872 89% 106 861 88% 117 840 86% 138 834 85% 144 822 84% 156 Number of Students % of Building Occupied Available Seats 9
Effect on Demographics % Afr. Amer. % 2 or More School % Asian % Hispanic No Change % White % FARMS % ESOL Gaithersburg MS 23.3% 7.5% 46.3% With Change 21.0% <5% 44.4% 13.0% Gaithersburg MS 21.5% 7.6% 46.6% 20.4% <5% 44.9% 13.1% No Change 11.5% With Change 11.6% Rosa Parks MS 12.0% 10.2% 61.7% <5% 10.9% <5.0% Rosa Parks MS 11.8% 10.1% 61.8% <5% 10.0% <5.0% 10
Gaithersburg HS Enrollment and Capacity (Maximum # of Seats=2407) 2017 18 2018 19 No Change 2019 20 2020 21 2021 22 2022 23 Number of Students 2480 103% -73 2496 104% -89 2524 105% -117 2539 105% -132 2590 108% -183 2736 114% -329 % of Building Occupied Available Seats With Change Number of Students 2475 103% -68 2491 103% -84 2519 105% -112 2534 105% -127 2585 107% -178 2731 113% -324 % of Building Occupied Available Seats 11
Sherwood HS Enrollment and Capacity (Maximum # of Seats=2183) 2017 18 2018 19 No Change 2019 20 2020 21 2021 22 2022 23 Number of Students 1933 89% 250 1989 91% 194 1981 91% 202 2012 92% 171 1984 91% 199 1959 90% 224 % of Building Occupied Available Seats With Change Number of Students 1938 89% 245 1994 91% 189 1986 91% 197 2017 92% 166 1989 91% 194 1964 90% 219 % of Building Occupied Available Seats 12
Effect on Demographics % Afr. Amer. % 2 or More School % Asian % Hispanic No Change % White % FARMS % ESOL Gaithersburg HS 24.8% 7.6% 49.1% With Change 15.4% <5.0% 41.3% 19.9% Gaithersburg HS 24.8% 7.6% 49.1% No Change 18.2% With Change 18.1% 15.2% <5.0% 41.3% 19.9% Sherwood HS 17.1% 11.5% 49.2% <5.0% 5.2% <5.0% Sherwood HS 17.1% 11.5% 49.3% <5.0% 5.2% <5.0% 13
Next Steps PTAs and organizations should hold meetings to gather input about option Committee members will share the input at the next meeting Committee members should fill out evaluation forms for next meeting PTAs should prepare position papers for next meeting 14
Website All materials will be posted on the following website: http://www.montgomeryschoolsmd.org/departme nts/planning/unityarea.aspx 15