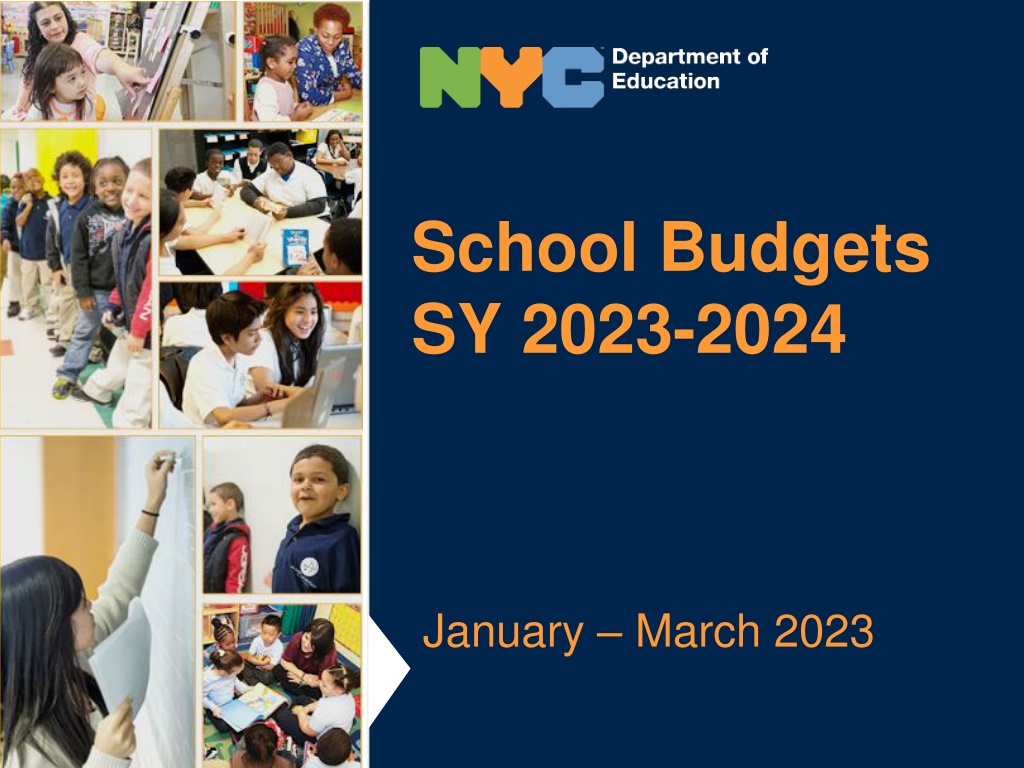
School Budgets SY 2023-2024
Explore the breakdown of NYC public school budgets for the fiscal year 2023, detailing funding sources, expenditure distribution, and decision-making processes at the school level. Discover how principals manage funding to address student and community needs effectively.

School Budgets SY 2023-2024
PowerPoint presentation about 'School Budgets SY 2023-2024'. This presentation describes the topic on Explore the breakdown of NYC public school budgets for the fiscal year 2023, detailing funding sources, expenditure distribution, and decision-making processes at the school level. Discover how principals manage funding to address student and community needs effectively.. Download this presentation absolutely free.
Presentation Transcript
School Budgets SY 2023-2024 January March 2023
Agenda Purpose Review the DOE's budget Review Fair Student Funding Proposed Changes for FY 2024 2
Where can I find information about my schools budget? Step 1: Choose a school Step 2: Select the Reports Tab Step 3: Open Budget and Finances Step 4: Review reports FSF Overview & Detail: Fair Student Funding Allocation at the beginning of the year Galaxy Allocation: Current budget by source of funding Budget Summary: Current budget by use of funding Expenditure Report: Summary of spending for the year (after the year is complete) 3
Where Does Our Funding Come From? Our budget for the 2022-23 school year (fiscal year 2023) is $37.6 billion. We estimate we will spend over $31,000 per student this year. Other Federal All Other $0.2b <1% Federal Stimulus $2b 5% $2b 5% City $20b 54% State $13b 36% Funding generally comes from income and corporate taxes, property taxes, and sales taxes. Per-student figures include students at DOE facilities; excludes Debt Payments, Transportation, and Food. All figures as of FY 2023 Adopted Budget 4 Draft - Privileged and Confidential
How Is NYC Public Schools Budget Spent? ($ in billions) Superintendents & Field $0.3, 1% Off the top: $10.5 billion goes to employee benefits, pension, and debt Central Admin. $0.3, 1% $3 billion goes to state-mandated payments to charter schools Non-Public & Contract Schools $2.0, 5% School Operations $4.3 11% $2 billion goes to non-public & contract schools as per special education mandates K-12 Schools & Instruction $15.1 40% Of the remaining: $15.1 billion goes to K-12 schools & instruction Charters $3.0, 8% $2.2 billion goes to early childhood programs Employee Benefits, Pension, & Debt $10.5 28% $4.3 billion goes to school operations About $300 million or 1% - goes to our central administrative offices. Another $300 million or 1% - goes to superintendents and field offices. Early Childhood $2.2, 6% As of FY 2023 Adopted Budget Draft - Privileged and Confidential 5
District 28 2022-2023 School Budgets District 28 Overall Budget Total: $390 million $83.5 million- 21% $266.2 million- 68% $40.7 million- 11% FSF Federal Other State and Local Draft - Privileged and Confidential
Who decides how the money is spent at the school level? Principals have a great deal of flexibility in deciding how this funding is spent so that they can target it to student and community needs. Principals along with their School Leadership Teams (SLTs) create the school s Comprehensive Educational Plan (CEP) based on school specific instructional needs and priorities. Principals work with their SLTs to create the school s budget, to pay for the instructional program detailed in the CEP. Superintendents supervise the Principal in this process and must approve all school budgets and their alignment with the school s CEP. 7
What is Fair Student Funding (FSF)? Fair Student Funding (FSF) is the largest funding stream that we provide to schools, and it is based on the number of student enrolled at each school + the specific needs of those students. Student needs are weighted based on the cost of meeting a student's educational need (e.g., academic needs, special education needs); and schools get more money for students with greater needs. FSF makes up about two-thirds of most K-12 NYCPS school budgets. Other funding sources include federal funding streams, such as Title I, Title III, IDEA (special-education funding), or other targeted allocations for specific initiatives. Charter schools, 3K, PreK, Mandated Individual Education Plan (IEP/special-ed) related services and IEP paraprofessionals (e.g., speech teachers, occupational therapists, and 1:1 paraprofessionals) are funded separately. FSF provides principals/schools with substantial flexibility to tailor spending to school and community needs. They can use for classroom teachers (including special education teachers and paraprofessionals), guidance counselors, social workers and classroom resources and materials. Draft - Privileged and Confidential 8
Fair Student Funding: How Does it Work? Four Building Blocks Combine to create each school s FSF Allocation Fair Student Funding Allocation Students & Their Needs Collective Bargaining Per Capita Foundation Foundation Foundation: All schools receive $225,000 each. Collective Bargaining: Contractual pay increases for school staff. Per Capita: The dollar value of an FSF student weight of 1. This is updated every year to reflect any changes to the citywide average teacher salary; it was approximately $4,200 this year. Number of students enrolled at each school, and the specific needs of those students. Pupil needs are weighted based on the cost of meeting the educational needs. See next slide for the table of weights. 9
SY 2022-2023 Fair Student Funding Weights Grade Base Weight Weight Grades K-5 1.00 Grades 6-8 1.08 Grades 9-12 1.03 Academic Intervention Weight Special Education Weight Poverty K-12 0.12 Low Intensity <=20% 0.56 Below Standards 4-5 0.25 Moderate Intensity 21% to 59% 1.25 Below Standards 6-8 0.35 Less Inclusive >=60% K-8 1.18 Below Standards 9-12 0.25 Less Inclusive >=60% 9-12 0.58 Well Below Standards 4-5 0.40 More Inclusive >=60% K 2.09 Well Below Standards 6-8 0.50 More Inclusive >=60% 1-12 1.74 Well Below Standards 9-12 0.40 Post IEP Transitional Support 0.12 Heavy Graduation Challenge (OAUC)1 Over-the-Counter (OTC) 9-12 0.40 Portfolio High Schools Weight Career and Technical Education (CTE) Tier 1 0.26 English Language Learners Weight Standalone English as a New Language (ENL) K-5 0.40 Career and Technical Education (CTE) Tier 2 0.17 Standalone English as a New Language (ENL) 6-12 0.50 Career and Technical Education (CTE) Tier 3 0.12 Career and Technical Education (CTE) Tier 4 Bilingual K-5 0.44 0.05 Bilingual 6-12 0.55 Specialized Academic 0.25 Commanding K-5 0.13 Specialized Audition 0.35 Commanding 6-12 0.12 0.40 Transfer Heavy Challenge (OAUC)1 Students with Interrupted Formal Education (SIFE) 0.12 Transfer Non-Heavy Challenge 0.21 1 Over-Aged and Under-Credited 10
How The FSF Weights Work If the Per Capita Were $1 Grade Weight English Language Learner Special Education Academic Intervention Portfolio Weight (HS only) 11
Improving Fair Student Funding (FSF) (1 of 2) While our funding methodology directs additional resources to schools with many high-need students.... For example, we know that our schools with the highest share of students in poverty have received an average of 26% more per capita funding than our schools with the lowest share of students in poverty. Similar patterns exist for students in temporary housing (27%), students with disabilities (36%) and English language learners (14%). 13
Improving Fair Student Funding (FSF) (2 of 2) We believe improvements can be made to FSF. As a result, the Chancellor created a working group, which met this summer and fall and issued their final recommendations in early November. The Working Group was tasked with: Reviewing and making recommendations relating to the Fair Student Funding formula, including the categories, types of students, grade levels, and weights within the formula, in order to best meet the needs of students citywide, while keeping equity at the core of our work. The group met biweekly both by video and in-person, and reviewed models created by both DOE and the IBO to look at the impacts of the proposed recommendations. Developing recommendations in time to inform the FY 2024 FSF formula 14
The Chancellor Has Accepted, and Is Proposing, The Following Recommendations from the Working Group: New weight to support Students in Temporary Housing (STH) Why this weight:Research shows that the situations faced by students in temporary housing create significant challenges to student success. How the weight works: Weight of 0.12 times the FSF per capita for the number of students in temporary housing in the school in the prior year. New weight to support schools with high percentages of student need, concentration weight. Why this weight: Having high concentrations of needy pupils has a negative impact on student achievement. How the weight works: Schools are ranked based on their proportion of student needs (e.g., students with disabilities, English Language Learners, students living in poverty, students in temporary housing, and others). Schools with the highest average student need are divided into 3 categories (tier 1, tier 2, and tier 3). Schools outside of the highest concentration receive no funding. Students attending schools in tier 1 receive a weight of 0.04, tier 2 0.08, tier 3 0.12. Concentrations weight times the school s average need for the prior year, times the register for the school year. 15
The Chancellor Has Also Accepted Additional Recommendations from the Working Group Which Do Not Directly Impact Fair Student Funding Weights In response to some other challenges identified by the Working Group, NYC Public Schools will do the following: Enhancing the budget appeals process to ensure it is responsive to schools special education staffing needs. Strive to improve budget transparency around both the FSF formula and NYC Public Schools budget as a whole. 16
SY 2023-2024 Proposed Fair Student Funding Weights Grade Base Weight Grades K-5 Grades 6-8 Grades 9-12 Weight 1.00 1.08 1.03 Academic Intervention* Poverty K-12 Below Standards 4-5 Below Standards 6-8 Below Standards 9-12 Well Below Standards 4-5 Well Below Standards 6-8 Well Below Standards 9-12 Heavy Graduation Challenge (OAUC) 2 Over-the-Counter (OTC) 9-12 Weight 0.12 0.25 0.35 0.25 0.40 0.50 0.40 New Weights Students in Temporary Housing Concentration Need Tier 3 Concentration Need Tier 2 Concentration Need Tier 1 Weight 0.12 0.12 0.08 0.04 English Language Learners Standalone English as a New Language (ENL) K-5 Standalone English as a New Language (ENL) 6-12 Bilingual K-5 Bilingual 6-12 Commanding K-5 Commanding 6-12 Students with Interrupted Formal Education (SIFE) Weight 0.40 0.50 0.44 0.55 0.13 0.12 0.12 0.40 Portfolio High Schools Career and Technical Education (CTE) Tier 1 Career and Technical Education (CTE) Tier 2 Career and Technical Education (CTE) Tier 3 Career and Technical Education (CTE) Tier 4 Specialized Academic Specialized Audition Transfer Heavy Challenge (OAUC)1 Transfer Non-Heavy Challenge Weight 0.26 0.17 0.12 0.05 0.25 0.35 0.40 0.21 Special Education1 Low Intensity <=20% Moderate Intensity 21% to 59% Less Inclusive >=60% K-8 Less Inclusive >=60% 9-12 More Inclusive >=60% K More Inclusive >=60% 1-12 Post IEP Transitional Support Weight 0.56 1.25 1.18 0.58 2.09 1.74 0.12 1 Over-Aged and Under-Credited. 17
School Budgeting Timeline February & March: Based on initial budget estimates of City and State revenue, the DOE presents the CECs with the proposed Fair Student Funding weights for the coming school year. The presentation tonight serves to advise CECs and school district communities of the formula and if there are any proposed changes. This presentation is also posted on the DOE s website at https://infohub.nyced.org/reports/financial/financial- data-and-reports. March: The Panel for Educational Policy votes on the Estimated Budget for 2023-2024, based on the City s Preliminary Budget. April: The Panel for Educational Policy votes on the proposed Fair Student Funding weights for the coming school year. Late Spring: DOE releases budget allocations to schools. June: Principals along with their School Leadership Teams propose budgets for the coming year. July: Superintendents must certify alignment between school budgets and Comprehensive Educational Plans (CEPs) for the coming year. September: The new school year begins! 18
Future Changes & Feedback We are continuing to review the formula to address other concerns we have heard about school budgeting in future years including challenges related to school size and enrollment shifts. We value your feedback! Comments and questions may be directed below by April 18, 2023. Via email to BudgetPublicComments@schools.nyc.gov OR By phone to (212) 374-6754. 19
QUESTIONS? 20
More Information Is Available Online About: Fair Student Funding, School Budgets, and the FSF Working Group You can find the following online on the DOE s Infohub, under Reports >> Financial Data and Reports : Detailed information about each and every school budget allocation in the form of school allocation memoranda or SAMs. A summary of each school's total and Fair Student Funding budget along with student and staff counts. A programmatic guide to Fair Student Funding, as well as how the FSF allocation is calculated for each school. You can find the following online on each individual school webpage, under Reports >> Budget and Finances : (see directions on slide 3) Detailed information of the school s budget based on the different types of funding schools receive, and Detailed information as to how the Principal has budgeted for the current year, including the number of staff positions and other planned spending. 21


?")


 (1 of 2)")
 (2 of 2)")