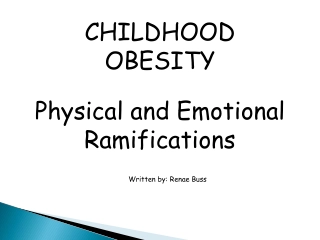
Childhood Obesity Trends in Tuba City: A Health Promotion Perspective
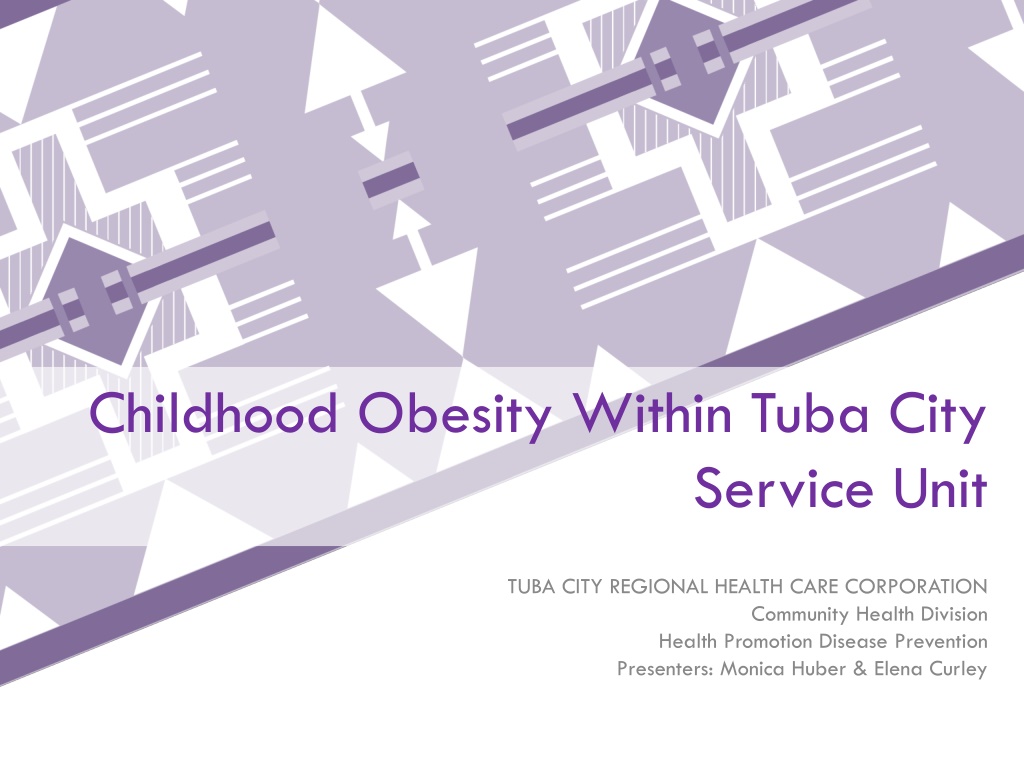
Childhood obesity trends in Tuba City, as presented by Monica Huber and Elena Curley from Tuba City Regional Health Care Corporation (TCRHCC), highlight the importance of health promotion and disease prevention initiatives. The data reveals a concerning rise in obesity rates among school-age children over the years, emphasizing the need for targeted interventions and community-based activities to address this public health issue effectively.

Download Presentation

Please find below an Image/Link to download the presentation.
The content on the website is provided AS IS for your information and personal use only. It may not be sold, licensed, or shared on other websites without obtaining consent from the author. Download presentation by click this link. If you encounter any issues during the download, it is possible that the publisher has removed the file from their server.
E N D
Presentation Transcript
Childhood Obesity Within Tuba City Service Unit TUBA CITY REGIONAL HEALTH CARE CORPORATION Community Health Division Health Promotion Disease Prevention Presenters: Monica Huber & Elena Curley
TCRHCC Provides services to a 6,000 square mile area. 8 Service Areas/Chapters. Approximately serves 100,000 individuals 94% Native Americans Services provided to the community includes comprehensive inpatient/outpatient emergency services; dental and ophthalmology services; orthopedics; OB/GYN, oral surgery; eye surgery; and urological procedure and community health services.
Health Promotion Disease Prevention Best Practice: Diabetes- related Education Services Provided: Take CHARGE School-Based Activities Community-Based Activities
Tuba City Childhood Obesity Trends School-Based Prevention Activities
Tuba City Service Area School-Age Childhood Obesity Trends 1% 1% 2% 4% 3% 3% 3% 2% 2% 2% 2% 2% 2% Thirteen-Year Percentile Body Mass Index (BMI) Trends Underweight 47% 46% 50% 53% 55% 51% 51% 50% 51% Healthy Weight 55% 58% 56% 54% 19% 18% 17% 16% 17% 18% 14% Overweight 19% 20% 17% 16% 18% 19% 33% 35% 31% 30% 29% 28% 29% 27% 27% Obese 25% 24% 24% 26% Fall 2022 Fall 2021 Fall 2019 Fall 2018 Fall 2017 Fall 2016 Fall 2015 Fall 2014 Fall 2013 Fall 2012 Fall 2011 Fall 2010 Fall 2009
Tuba City Service Area School-Age Childhood Obesity Trends Over Time TCSU 13-Year Fall Percentile BMI Trends 60 55 55 55 54 53 53 52 51 51 51 49 50 45 41 38 40 35 31 30 29 %BMI 28 27 27 27 27 30 26 25 24 20 19 19 19 18 18 18 18 18 17 17 17 20 16 10 0 2009 2010 2011 2012 2013 2014 2015 2016 2017 2018 2019 2021 2022 Healthy Weight Overweight Obese
Fall 2022 Childhood Obesity by Schools 100% 90% 29% 30% 31% 32% 34% 36% 37% 39% 39% 80% 38% 43% 70% 11% 17% 60% 19% 21% 17% 20% 19% 16% 18% 50% 22% 18% 40% 53% 30% 51% 48% 44% 44% 47% 45% 43% 43% 35% 20% 38% 10% 7% 4% 4% 2% 2% 2% 1% KBS 1% TCBS 0% 0% THES 0% DLES 0% RRBS TCES MDS TCJHS TCHS TDS GAHS Underweight Healthy Weight Overweight Obese
Childhood Obesity by Location Fast Food Accessibility Fresh Fruit & Vegetables Availability Exercise Opportunities Grocery Store Access School Environment VS. Community Environment Time Spent at School VS. Home
School-Based Services Coordinated Approach to School Health (CASH) Program 11 Schools School Health Team Leaders Classroom Movement Break Challenge Bi-Annual FitnessGram Assessment Capacity Building for Staff/Families
Take C.H.A.R.G.E Childhood Obesity Intervention Program Eligible target group: Referral-based 9-12yo BMI Percentile equal and greater than 85% 12-week Course Pre/Post FitnessGram Assessment Deliver culturally appropriate nutrition education, Physical Activity and life skills for youth and their families.
Community-Based Activities Get Fit Challenge Just Move It Hiking Series Community Health Improvement Planning (CHIP) Lifestyle Balance Classes Nutrition & Physical Activity Education & Demonstrations HPDP Fitness Classes for Youth and Adults
Family, Collaboration & Community Partnerships Teamwork & Communication Administrator Meetings School Health Team Leader Meetings Pediatric Obesity Task Force Meetings Community Health Improvement Planning Meetings Collaboration Meetings
Recipe for Success- A Coordinated Approach CHIP SCHOOL HEALTH INDEX TRAINING Environment EXERCISE FRIENDLY COMMUNITY SCHOOL HEALTH NEWSLETTER REGIONAL FOOD SYSTEMS TEAM Community ACTIVE SUMMER YOUTH PROGRAM SOCIAL MARKETING JUST MOVE IT PEDIATRIC OBESITY TASK FORCE YOUTH BASKETBALL LEAGUE LOCAL WELLNESS POLICY YOUTH BASEBALL LEAGUE LIFESTYLE HEALTH EDUCATION SCHOOL HEALTH TEAM LEADER INITIATIVE Schools FITNESS CENTER END YEAR SCHOOL HEALTH LUNCHEON AYSO SOCCER League JUNK FOOD TAX INITITIAVE MY PLATE, MY FAMILY CURRICULUM ZUMBA 4 KIDS/TEENS SCHOOL GARDEN EDUCATION LOCAL WELLNESS POLICY GAREN EXPO PARENT/STUDENT DIABETES-RELATED EDUCATION GET FIT CHALLENGE Family NAVAJO NATION TRAILS INITITIAVE FITNESSGRAM PROJECT AFTERSCHOOL PROGRAM FAMILY NIGHTS LIFE SKILLS NAVAJO WELLNESS MODEL FAMILY NIGHTS CLASSROOM MOVEMEENT BREAKS EXERCISE FVRX PROGRSM HIKING SERIES CULTURE BEHAVIORAL HEALTH NUTRITION Individual YOUTH FITNESS CENTER EDCUATION CENTER TAKE CHARGE