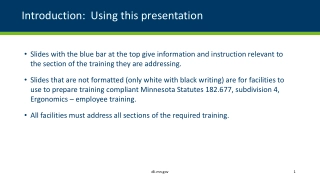
Medicaid Managed Care Trends in Minnesota's Health Market

Explore the unique landscape of Minnesota's Medicaid managed care system, highlighting key trends for providers and health plans, financial analysis, hospital interactions, and a comparison with other states. Discover the differences in Minnesota's healthcare structure, including limited presence of national insurers, investor-owned hospitals, and an emphasis on provider consolidation. Delve into the challenges and opportunities facing provider systems in a changing healthcare environment, with a focus on the Twin Cities market dynamics and trends in inpatient care.

Medicaid Managed Care Trends in Minnesota's Health Market
PowerPoint presentation about 'Medicaid Managed Care Trends in Minnesota's Health Market'. This presentation describes the topic on Explore the unique landscape of Minnesota's Medicaid managed care system, highlighting key trends for providers and health plans, financial analysis, hospital interactions, and a comparison with other states. Discover the differences in Minnesota's healthcare structure, including limited presence of national insurers, investor-owned hospitals, and an emphasis on provider consolidation. Delve into the challenges and opportunities facing provider systems in a changing healthcare environment, with a focus on the Twin Cities market dynamics and trends in inpatient care.. Download this presentation absolutely free.
Presentation Transcript
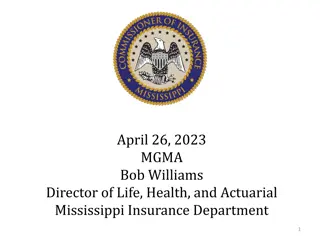
Medicaid Managed Care and the Minnesota Market Presented to: Health Finance and Policy Committee Minnesota House of Representatives December 1, 2023 Allan Baumgarten, J.D., M.A.
Presentation Outline Introduction How is Minnesota different? Key trends for providers and health plans Medicaid managed care: financial analysis Medicaid and hospitals Procurement processes and contract oversight Comparing Minnesota and other states
How is Minnesota Different? Limited presence of national insurers, investor- owned hospitals Moratorium on new hospitals, nursing homes, group homes since 1984 Years of consolidation have led to highly concentrated markets for payers and providers. Extent of vertically integrated provider systems; high percentage of physicians, hospitals in systems Low use of capitation, other provider risk-sharing
Trends for Provider Systems Seeking growth: Further consolidation going beyond state boundaries Continued profitability Declining or flat inpatient days; moves away from investment in inpatient facilities? Medicare and Medicaid cover a growing share of hospital care; hospitals more vulnerable to changes in government policies
Three Systems in Twin Cities Have 71% of Market Based on Revenues Other, 5.8% North Memorial, 6.8% Fairview, 27.7% Children's, 7.5% Hennepin County, 9.4% HealthPartners, 17.3% Allina, 25.6%
Twin Cities Hospital Systems: Net Income, 2012-2021 800,000,000 700,000,000 600,000,000 500,000,000 400,000,000 300,000,000 200,000,000 100,000,000 - 2012 2013 2014 2015 2016 2017 2018 2019 2020 2021
Flat, Declining Inpatient Days for Minneapolis-St. Paul Hospitals 1,800,000 1,600,000 1,400,000 1,200,000 1,000,000 800,000 600,000 400,000 200,000 0 2005 2006 Fairview Park Nicollet* Children's 2007 2008 2009 2010 2011 2012 2013 2014 2015 2016 2017 2018 2019 2020 2021 Allina HealthEast* Hennepin County HealthPartners North Memorial Other*
Expansion of Market Boundaries In Wisconsin highly regarded regional systems merging Froedtert with ThedaCare, Gundersen with Bellin; others in the works; also lots of construction Non-contiguous hospital mergers: Advocate-Atrium, Mercy-Bon Secours, Dignity-CHI For health plans: expansion of Medica to 7 states, HealthPartners ventures in five states
Health Plan Trends Overall enrollment growth, especially for Medicaid, Medicare Advantage and individual plans; seeing modest decline so far with Medicaid unwinding Record HMO profits in 2022, led by Medicaid/public programs New competition from UnitedHealthcare (with Medicaid contracts) and Allina-Aetna Does the non-profit/for-profit distinction matter?
HMO Enrollment Growth, 1987-2022 2,000,000 1,800,000 1,600,000 1,400,000 1,200,000 1,000,000 800,000 600,000 400,000 200,000 0 Commercial Public Programs Medicare
Minnesota HMOs Record Profits in 2022 800,000,000 600,000,000 400,000,000 200,000,000 - 2012 2013 2014 2015 2016 2017 2018 2019 2020 2021 2022 (200,000,000) (400,000,000) (600,000,000)
Underwriting Income for Minnesota Public Programs, 2000-2022 800.00 726.54 600.00 Add in 2011 Underwriting Income 400.00 256.41 200.00 232.24 197.02 180.56 88.00 135.29 117.40 98.44 83.94 -13.05 72.7448.5266.92 70.5967.10 0.00 39.3217.01 2000 2001 2002 2003 2004 2005 2006 2007 2008 2009 2010 2011 2012 2013 2014 2015 2016 2017 2018 2019 2020 2021 2022 20.8011.10 9.41 3.50 -131.10 -200.00 -376.72 -400.00 -600.00
Trends in Revenues and Expenses for Medicaid Plans Year Revenues PMPM Revenues PMPM Medical Expenses Medical Loss Ratio Profit Margin 2022 $6.8 billion $550.25 $456.03 82.9% 7.1% 2021 $5.5 billion $486.99 $433.83 89.1% 2.0% 2020 $4.4 billion $458.33 $411.76 89.8% 1.0% Change 2022/2020 52.5% 20.1% 10.8% -7.7% 702.7%
2022 Results for Other State Programs Program Revenues PMPM Revenues PMPM Medical Expenses Medical Loss Ratio Profit Margin MN Senior Health Options $2.0 billion $3,761.88 $3,269.35 86.9% 7.0% Minnesota Care $658 million $527.50 $449.68 85.2% 4.8% Special Needs Basic Care $866 million $1,411.44 $1,254.18 88.9% 3.6% MSC+ $290 million $1,657.85 $1,352.03 81.6% 12.2%
Medicaid and Hospitals In 2021, Medicaid, both managed care and fee-for- service, paid for 27.7% of inpatient days at Twin Cities area hospitals and 21.6% at hospitals serving Greater Minnesota communities. Likely a smaller percentage of overall revenues
Procurement Process and State Oversight of Contractor Performance Determining the optimal number of contractors Determining the length of the contract term Setting payment rates, whether through competitive bid or by state s actuaries - Linking MCO selection to state goals and strategies Mechanisms for managing market share and the auto-enroll algorithm Mechanisms for linking payment, including enhancements and penalties, to plan performance and to improvements in health status
Comparing Minnesota With Other States Michigan on rate setting, premium revenues and margins Arizona on using procurement to move Medicaid toward state goals Ohio on centralizing/carving out PBM and claim processing
Comparing Medicaid Managed Care in Minnesota and Michigan, 2022 Measure Minnesota Michigan Average Revenue PMPM $550.25 $312.30 Average Medical PMPM $456.03 $275.43 Medical Loss Ratio 82.9% 88.2% Average Underwriting Margin 4.6% 2.8%
For Additional Information Allan Baumgarten www.AllanBaumgarten.com 4800 W. 27th Street Minneapolis, MN 55416 E-mail: Baumg010@umn.edu 952/212-8589 Twitter @allanbaumgarten


![Skincare Market Growth & Key Industry Developments [2030]](/thumb/26741/skincare-market-growth-key-industry-developments-2030.jpg)