Analysis and Modelling of Specific Energy Consumption in Thermal Power Plants
This analysis focuses on the specific energy consumption for the transportation of coal ash slurries in thermal power plants using Computational Fluid Dynamics (CFD). The study emphasizes the efficiency factor in energy consumption and its impact on the national economic engine. It also discusses the increase in energy demand, the role of thermal power plants in the country, and the challenges related to coal ash disposal. The research provides insights into ash accumulation points and the distribution of fly ash and bottom ash in the context of pipeline transportation.

Analysis and Modelling of Specific Energy Consumption in Thermal Power Plants
PowerPoint presentation about 'Analysis and Modelling of Specific Energy Consumption in Thermal Power Plants'. This presentation describes the topic on This analysis focuses on the specific energy consumption for the transportation of coal ash slurries in thermal power plants using Computational Fluid Dynamics (CFD). The study emphasizes the efficiency factor in energy consumption and its impact on the national economic engine. It also discusses the increase in energy demand, the role of thermal power plants in the country, and the challenges related to coal ash disposal. The research provides insights into ash accumulation points and the distribution of fly ash and bottom ash in the context of pipeline transportation.. Download this presentation absolutely free.
Presentation Transcript
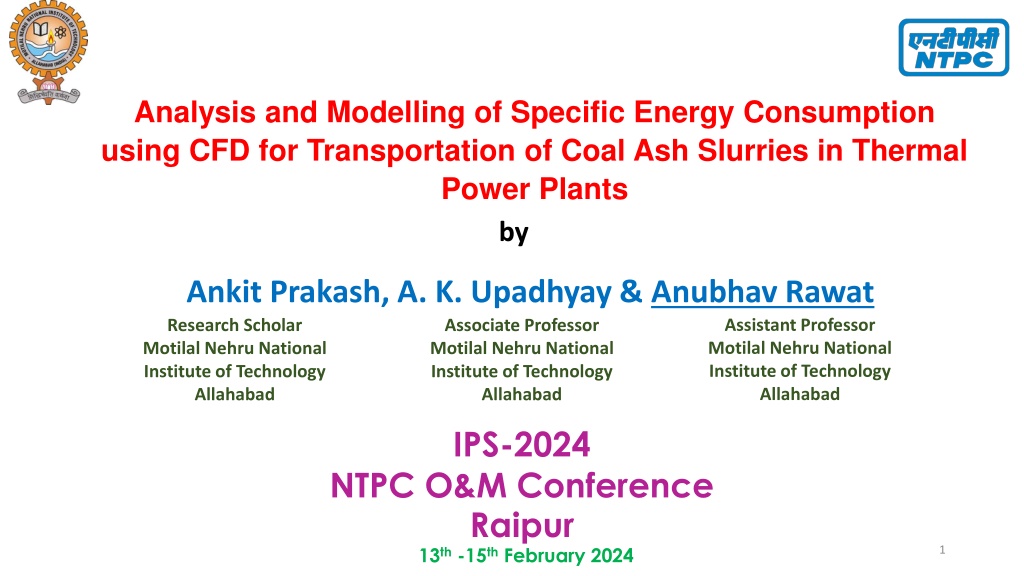
Analysis and Modelling of Specific Energy Consumption using CFD for Transportation of Coal Ash Slurries in Thermal Power Plants by Ankit Prakash, A. K. Upadhyay & Anubhav Rawat Associate Professor Motilal Nehru National Institute of Technology Allahabad Allahabad Assistant Professor Motilal Nehru National Institute of Technology Allahabad Research Scholar Motilal Nehru National Institute of Technology IPS-2024 NTPC O&M Conference Raipur 13th -15th February 2024 1
Introduction Output Input National Economic Engine (Energy) (GDP) ??? ($ ?? ??.) Efficiency Factor f = ?????? ??????????? (?? ?? ??) Figure 1 World oil production estimates for 100 years. Hubbert s Peak curve, [Figure source: Hubbert s Peak , Kenneth S. Deffeyes, Princeton University Press, 2006] [1] World oil production throughout the year 2000 is shown as heavy dots. Deffeyes (2006) explains Hubbert s method used to estimate the most likely future production. The dashed lines on the right show the probable production rates if the ultimate discoverable oil is 1.8 trillion barrels (lower curve) or 2.1 trillion barrels (upper curve). Figure 2 People without access to electricity (million) in 2014 [Source: World Development Indicators] [2] 2
Increase in energy demand of the nation. GDP of the country is highly dependent on energy required by the nation. 0.13% 11.25% 0.14% The role of thermal power plant is not going to 16.1% 5.96% 1.59% 1.19% decrease in coming decades. 10.29% Easy to build, operate and maintain compared to other energy sources. 2.46% 1.63% Total Installed Energy capacity as on 31-05-2023 is 49.27% Coal Hydro Small Hydro Power BM Power/Cogen Lignite Waste to Energy Gas Diesel Solar 417668 MW. Wind Nuclear Likely to commissioned 7.01 GW capacity in 2022- Figure 3 Installed Energy Capacity of India as on 31- 05-23 [3] 23, and added 8 plants with 4.49 GW capacity in 2021-22. 39 thermal coal plants under construction [3, 4] 3
The map shows that the thermal power plant is available every part of India. Thus safe disposal of coal ash is a major challenge everywhere. Fig.4 Major Thermal Power Plants of India [5] 4
Ash = Fly ash + Bottom ash Fly Ash- Size in few hundred microns. 85 to 90% of total ash. Bottom Ash- Very coarse particles and large lumps. 10 to 15% of total ash. Thus current study is primary focused on Fly ash. Figure 5 Ash Accumulation Points and typical Ash Distribution of a Dry Bottom Furnace [6] 5
Pipeline Transportation: Transportation of materials with the help of pipes. Uses: Petrochemicals, Pharmaceuticals, Food Powders and many more. Classification: Based on loading rate ratio I. Dilute Phase Conveying II. Dense Phase Conveying Based on carrier fluid I. Pneumatic Conveying Carrier fluid is gases (in general air). II. Hydraulic Conveying Carrier fluid is liquid (in general water). 6
Flow Regime ?? ?c 4 3 1 3 ?c4 ????= 1 + ?c Where xc is evaluated from the following relation: ?c ?? 3= 1 ?c 16800 ? ??? ?0???2 ?? ?0 ?? ?0 ?0 , ?? = ??? ?c= = = ???22 ? ??4? The above criterion given by Hanks (1967) for transition Reynolds number was used to decide whether the flow is in the laminar or the turbulent regime. According to this criterion, flow was considered laminar if Bingham Reynolds number is less than ReBC otherwise it was assumed to be turbulent. 7
Fluid Properties The rheology of high concentration Fly-ash slurries from Rawat, Singh and Seshadri (2017) Table 1 Rheological Properties of Fly-ash Slurry Cw (% by weight) Density (kg/m3) Sl. No. Yield Stress (Pa) Bingham (Pa.s) Viscosity 1 2 3 4 5 55 60 62 65 68 1394.72 1446.63 1468.49 1502.63 1538.23 0.173 0.317 0.484 0.736 1.6730. 0.007 0.0136 0.0282 0.0502 0.1388 Specific gravity of Fly-ash = 2.06 Weighted Mean Diameter ??? = 0.035 mm Table 2 Particle Size Distribution of Fly-ash Size ( m) PSD (%) 300 200 100 74 53 43 38 25 18 13 9 7 5 3 100 97.8 88.9 84.4 75.1 69.1 67.2 53.6 45.8 36.1 24.4 16.7 7 3.1 8
Governing Equations Continuity Equation ?. ?? = ? ??? ??? ?? ?? ?????, ? = ?? ?? + ??:?????? ????????????? ?? ???? ? (?? %) ?? ??????? ?? ????? ?? ??????? (?? ?? ??????? ?? ?????? ?? ??????? (?? ?? ?3) ?? ?3) Momentum Equation ?. ??? = ?? + ?. ? ??? ??? +??? ??? ? = ??+ ?? ? ??? ? = ?????, ?0 ????? ?????? ?? ?? ???? ?? ????????? (??.?) 9
Geometry l = 5, 6, 8, 8, 9, 12 m respectively so that study could be conducted on fully developed flow. D = 75, 100, 125, 150, 200 mm a = 10 mm 10 Figure 6 Cross- sectional view and profile view of the horizontal pipe
Meshing In the meshing tool, Multizone mesh method is used along edge sizing and inflation to make fine and structured grid. Figure 7 Hexahedral Multizone meshing 11
Meshing 12 Figure 8 Sectional view of the mesh
Boundary Conditions Boundary Conditions: I. Inlet_mesh: Velocity-inlet [Velocity: constant; Gauge Pressure: 0 Pa] II. Interior-part-solid_mesh: Interior III. Outlet_mesh: Outflow [=1] IV. Pipe wall_mesh: Wall [Wall Motion: Stationary wall ; Shear Condition: No Slip ; Roughness constant: default] 13
Validation 40 From figure it is clear that k- SST is most Experimental verma et. al. (2010) SST k- Std k- BSL k- Std k- RNG k- Realizable k- 35 suitable as the percentage deviation lies in the 30 range of 4-14%. Pressure Drop (Pa/m) 25 Although, k- BSL and k- RNG are also close 20 to the experimental result but k- SST gives 15 minimum deviation. 10 Literature review also supports the result. 5 Thus, k- SST is selected for further study. 0 0.7 1.4 2.1 Laminar flow regime is validated by using Velocity (m/s) Figure 9 Pressure Drop vs velocity at various models and comparison with experimental result of Verma et al. (2010) Buckingham-Reiner equation which gives minimal deviation from computational result. 14
GIT -1 5.0x10 -1 5.2x10 Pressure Drop Pressure Drop M* M 5 M 8 M 7 -1 5.1x10 Pressure Drop (Pa/m) M 4 -1 4.9x10 Pressure Drop (Pa/m) M 4 M * M 3 -1 5.0x10 M 2 M 5 M 2 M 1 -1 4.9x10 -1 4.8x10 -1 4.8x10 M 1 -1 4.7x10 -1 4.7x10 0.0 5 5 5 5 2.0x10 4.0x10 6.0x10 8.0x10 0 6 6 6 1x10 2x10 3x10 Mesh Elements Mesh Elements Figure 11 GIT of Pressure Drop vs Mesh Elements at D = 0.1m Figure 10 GIT of Pressure Drop vs Mesh Elements at D = 0.075m M* is the selected mesh after GIT for further study. 15
-1 1.80x10 -1 1.4x10 Pressure Drop Pressure Drop -1 1.3x10 -1 M 6 1.73x10 M 2 M 5 M * Pressure Drop (Pa/m) M 3 Pressure Drop (Pa/m) M 7 M 1 -1 M * 1.3x10 M 4 -1 1.65x10 M 6 M 2 M 3 -1 1.2x10 M 1 -1 1.58x10 -1 1.1x10 -1 1.50x10 -1 1.1x10 0.00 6 6 6 1.50x10 3.00x10 4.50x10 0.00 6 6 6 1.50x10 3.00x10 4.50x10 Mesh Elements Mesh Elements Figure 13 GIT of Pressure Drop vs Mesh Elements at D = 0.15m Figure 12 GIT of Pressure Drop vs Mesh Elements at D = 0.125m 16
Results and Discussions: Effect of solid concentration on energy consumption (specific) 0.20 0.6 D=0.075m D=0.1m D=0.125m D=0.15m D=0.2m V=0.5m/s V=1m/s V=1.5m/s V=2m/s 0.5 0.15 0.4 SEC (kW.h/t.km) SEC (kW.h/t.km) 0.3 0.10 0.2 0.05 0.1 0.00 0.0 0.50 0.55 0.60 0.65 0.70 0.50 0.55 0.60 0.65 0.70 Cw Cw (a) D = 0.2 m Figure 14 SEC vs Solid Concentration (Cw) (b) V = 2 m/s 17
Effect of Pipe diameter on energy consumption (specific) 0.4 0.6 V=0.5m/s V=1m/s V=1.5m/s V=2m/s Cw=0.55 Cw=0.6 Cw=0.62 Cw=0.65 Cw=0.68 0.5 0.3 0.4 SEC (kW.h/t.km) SEC (kW.h/t.km) 0.2 0.3 0.2 0.1 0.1 0.0 0.0 0.05 0.10 0.15 D (m) 0.20 0.25 0.05 0.10 0.15 D (m) 0.20 0.25 (a) V = 2 m/s Figure 15 SEC vs Pipe Diameter (D) (b) Cw = 60% 18
Effect of Flow Velocity on energy consumption (specific) 0.20 0.4 Cw=0.55 Cw=0.6 Cw=0.62 Cw=0.65 Cw=0.68 D=0.75 m D=0.1 m D=0.125 m D=0.15 m D=0.2 m 0.15 0.3 SEC (kW.h/t.km) SEC (kW.h/t.km) 0.10 0.2 0.05 0.1 0.00 0.0 0.0 0.5 1.0 1.5 2.0 2.5 0.0 0.5 1.0 1.5 2.0 2.5 V (m/s) V (m/s) (a) D = 0.2 m Figure 16 SEC vs Flow velocity (V) (b) Cw = 60% 19
Effect of solid throughput on energy consumption (specific) Solid Throughput (ST): In thermal power plants, generally the fly ash slurry is measured in solid throughput. Which is given by Where, D = pipe diameter V = velocity ??= vol. concentration of slurry ?= fly ash density ST = 4?2??? ? Here, for present study the values of solid throughput lies in the range of 6 to 236 ton/hrs. for different concentration and pipe diameters lying in the range of 55 % to 68 % and 0.075 m to 0.2 m respectively having weighted mean particle diameter 34.5 m. Based on the three solid throughput value the current study is trying to show the effect of Solid Throughput on SEC. 20
Effect of solid throughput on energy consumption (specific) 0.6 D=0.075m D=0.1m D=0.125m D=0.15m D=0.2m With the increase in solid throughput at constant pipe diameter the SEC will also increase. 0.5 0.4 SEC (kW.h/t.km) 0.3 At constant solid throughput with the increase in pipe diameter the required SEC will decrease. 0.2 0.1 0.0 0 50 100 150 200 250 Solid Throughput (ton/hr) Figure 17 SEC vs Solid Throughput (ST) 21
Effect of solid throughput on energy consumption (specific) Based on the current trend between SEC and solid throughput (ST) at various pipe diameter (D) an allometric power law curve fitting is used to establish a relation between SEC, ST and D, as shown below. SEC =3.33 x 10 10 ST3.4 D0.3 D6 The above equation shown good agreement when compared with the experimental and computational results with minimal deviation. The R2 value of the above equation lies in the range of 0.995 0.999. 22
Conclusions: Based on the results obtained form the current study following conclusions are drawn: With the increase in concentration and flow velocity, the SEC increases non-linearly. With the increase in pipe diameter, the SEC decreases non-linearly. With the increase in Solid throughput (ST), the SEC increases non-linearly. The current work can be referred for designing of pipeline systems for high concentration slurry transportation whose rheological properties are similar to that of fly ash slurry. 23
References: 1. Deffeyes, K.S., 2006. Beyond oil: The view from Hubbert's peak. Hill and Wang. 2. https://blogs.worldbank.org/opendata/chart-globally-over-1-billion-people-lack-access-electricity 3. https://powermin.gov.in/en/content/power-sector-glance-all-india 4. https://www.spglobal.com/commodityinsights/en/market-insights/latest-news/coal/060322-india- expected-to-commission-10-thermal-coal-power-plants-in-2022-23-add-7010-mw 5. https://www.mapsofindia.com/maps/india/coalreserves.htm 6. Mills, D., & Agarwal, V. K. (2001). Pneumatic conveying systems. Trans tech publications, 345. 7. Kaushal DR, Navneet K. Optimum design of high concentration fly ash slurry disposal pipeline. Electronic Journal of Polish Agricultural Universities. 2013;16(4). 8. Rawat A, Singh SN, Seshadri V. Computational methodology for determination of head loss in both laminar and turbulent regimes for the flow of high concentration coal ash slurries through pipeline. Particulate Science and Technology. 2016 May 3;34(3):289-300. 9. Verma AK, Singh SN, Seshadri V. Pressure drop prediction for the flow of fly ash slurries through pipes at high concentrations. International Journal of Fluid Mechanics Research. 2010;37(4). 24
References: 10. Singh MK, Ratha D, Kumar S, Kumar D. Influence of particle-size distribution and temperature on rheological behavior of coal slurry. International Journal of Coal Preparation and Utilization. 2016 Jan 2;36(1):44-54. 11. Rawat A, Singh SN, Seshadri V. Computational methodology for determination of head loss in both laminar and turbulent regimes for the flow of high concentration coal ash slurries through pipeline. Particulate Science and Technology. 2016 May 3;34(3):289-300. 12. Rawat A, Singh SN, Seshadri V. Variation of physical and rheological properties of fly ash slurries with particle size and its effect on hydraulic transportation at high concentrations. Particulate Science and Technology. 2019 Feb 17;37(2):151-60. 13. Rawat A, Singh SN, Seshadri V. Computational investigation on the flow of high concentration fly ash slurries through converging-diverging bends. International Journal of Coal Preparation and Utilization. 2019 Jul 15:1-21. 14. Mishra R, Singh S, Seshadri V. Velocity distribution in horizontal pipes conveying non-uniform particles. International Journal of Fluid Mechanics Research. 2002;29(6). 15. Kumar U, Mishra R, Singh SN, Seshadri V. Effect of particle gradation on flow characteristics of ash disposal pipelines. Powder technology. 2003 May 29;132(1):39-51. 25
References: 16. Hashemi SA, Wilson KC, Sanders RS. Specific energy consumption and optimum operating condition for coarse-particle slurries. Powder technology. 2014 Aug 1;262:183-7. 17. Hegde R. Specific Energy Consumption (SEC) for pipeline transport of liquid CO 2 slurries. University of Alberta (Canada); 2013. 18. Singh MK, Kumar S, Ratha D, Kaur H. Design of slurry transportation pipeline for the flow of muti- particulate coal ash suspension. International journal of hydrogen energy. 2017 Jul 27;42(30):19135-8. 19. Wu J, Graham L, Wang S, Parthasarathy R. Energy efficient slurry holding and transport. Minerals Engineering. 2010 Aug 1;23(9):705-12. 20. Li M, He Y, Jiang R, Zhang J, Zhang H, Liu W, Liu Y. Analysis of minimum specific energy consumption and optimal transport concentration of slurry pipeline transport systems. Particuology. 2022 Jul 1;66:38- 47. 21. Seitshiro I, Sato I, Sato H. Verification and Application of Design Model for Settling Slurry Transport in Pipes. International Journal of the Society of Materials Engineering for Resources. 2012;18(2):44-50. 22. Rawat A, Singh SN, Seshadri V. CFD analysis of the performance of elbow-meter with high concentration coal ash slurries. Flow Measurement and Instrumentation. 2020 Apr 1;72:101724 26
THANK YOU! 27


")
")
")
")
")