Academic Progress Monitoring for Effective Instructional Planning

Academic progress monitoring involves measuring student performance to evaluate responsiveness to interventions, guide instructional decisions, and determine when adjustments are necessary. It helps identify students needing additional support, compare instructional effectiveness, decide on changes, estimate improvement rates, and support communication with parents and IEP goal setting. Monitoring progress differs from progress monitoring, with the latter being more structured and targeted for individual students.
- Academic Progress Monitoring
- Instructional Planning
- Student Performance
- Intervention
- Educational Assessment

Academic Progress Monitoring for Effective Instructional Planning
PowerPoint presentation about 'Academic Progress Monitoring for Effective Instructional Planning'. This presentation describes the topic on Academic progress monitoring involves measuring student performance to evaluate responsiveness to interventions, guide instructional decisions, and determine when adjustments are necessary. It helps identify students needing additional support, compare instructional effectiveness, decide on changes, estimate improvement rates, and support communication with parents and IEP goal setting. Monitoring progress differs from progress monitoring, with the latter being more structured and targeted for individual students.. Download this presentation absolutely free.
Presentation Transcript
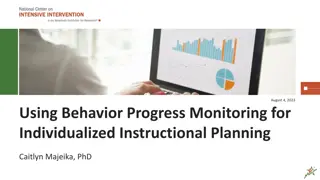
August 4, 2023 Using Academic Progress Monitoring for Individualized Instructional Planning Jon Potter, PhD
Agenda Progress monitoring overview Approaches and tools for academic progress monitoring Goal setting Making instructional decisions for individual students Available NCII resources 2
Progress Monitoring Overview 3
What is Progress Monitoring? Progress monitoring is repeated measurement of student performance over the course of intervention to index/quantify responsiveness to intervention and to thus determine, on an ongoing basis, when adjustments to the program are needed to improve responsiveness. National Center on Intensive Intervention, 2017 4
Monitoring Progress vs. Progress Monitoring Monitoring progress is not the same as progress monitoring. Monitoring Progress Progress Monitoring Often informal or unstandardized Valid and reliable measures, with standardized delivery Can occur during daily instruction Frequency depends on intensity of instruction and recommendations of the developer (e.g., weekly or monthly) Provides data for immediate, real-time instructional decisions Uses formative assessments, questioning, providing feedback, and similar strategies Requires ongoing and graphed data (i.e., 6 9 data points for valid interpretation Used for all students Used for entitlement decisions and students receiving targeted and intensive interventions 5
Why Is Progress Monitoring Important? Identify students who are not making adequate progress Compare the efficacy of different forms of instruction Determine when an instructional change is needed Data allow us to Estimate the rates of improvement (ROI) across time Support communication with parents and students Support the development of present levels of performance, IEP goals, and monitoring plan for students with disabilities 6
Getting Started with Progress Monitoring: Select the Target and Measure Determine target behavior Identify a measure Single Skill Measure General Outcome Measure 8
Identify a Measure: Key Characteristics Have sufficient number of alternate forms of equal and controlled difficulty. Specify minimum acceptable growth. Provide benchmarks for minimum acceptable end-of-year performance. Have reliability and validity information for the performance-level score and for growth for students with intensive needs. 9
In the Chat: In which academic areas do you currently have progress monitoring measures that you use? In which academic areas do you need to progress monitoring measures? 10
Goal Setting 11
Steps for Goal Setting Establish Baseline Performance Choose a Goal-Setting Strategy Write a Measurable Goal 12
Establish a Baseline Option 1. Use the student s score Option 2: Administer three progress from universal screening. monitoring probes in one testing session and select the median Set the baseline using the same score. tool for progress monitoring
Choose a Goal-Setting Strategy 1. Benchmarks 2. National norms for weekly ROI 3. Intra-individual framework 14
Goal-Setting Strategy Option 1: Benchmarks Benchmark: specifies the level of performance expected on a specific measure at a specific point in time, usually the end of the student s present grade level. Steps for setting a goal using benchmarks: Identify the appropriate grade level benchmark for the timeframe. Graph the benchmark and draw a line between the baseline and goal. 15
Option 1: Benchmarks for Middle- or End-of-Year Performance SAMPLE 2nd Grade: Reading Connected Text 100 90 80 70 60 50 40 Spring Benchmark: 90 WRC 30 20 10 0 Sept Oct Nov Dec Jan Feb Mar Apr May 16
Where do you find benchmarks? Published Research Publisher Data Systems NCII Resource: https://intensiveintervention.org/resource/u pdate-compiled-orf-norms NCII Resource: https://charts.intensiveintervention.org/chart /progress-monitoring 18
Option 2: National Norms for Rate of Improvement Rates of Improvement (ROI): average growth students are expected to make per week on a specific measure, according to local or national norms. There is a standard formula for calculating goal using rate of improvement (ROI): ROI x # Weeks + Baseline Score = GOAL ROI = Baseline = 30 Digits GOAL = 50 Digits + = 10 Weeks X 2 Digits/Week
Option 2: National Norms for Rate of Improvement 2 SAMPLE 2nd Grade: Reading Connected Text 100 90 80 70 60 50 40 30 20 10 0 Sept Oct Nov Dec Jan Feb Mar Apr May 20
Option 3: Intra-Individual Framework Intra-Individual Framework: uses the student s previous growth rate to calculate the individualized goal. Target Growth Rate # of Weeks Baseline Score X X + Slope = Goal Represents the student s rate of improvement (SROI) Represents growth needed to close the gap For example, if student needs to make 50% more progress, target growth rate would be 1.5 Need 6-9 data points 23
Setting a Goal Using an Intra-Individual Framework SAMPLE 2nd Grade: Reading Connected Text 100 90 80 70 Baseline 19 Target Growth Rate 1.5 Slope 1.0 # of Weeks 10 + = X X 60 50 40 30 20 Baseline = 19 WRC 10 0 Week 1 Week 2 Week 3 Week 4 Week 5 Week 6 Week 7 Week 8 Week 9 Week 10 Week 11 Week 12 Week 13 Week 14 Week 15 Week 16 Week 17 Week 18 Week 19 24
Write a Measurable Goal Quality IEP goals address the condition, or context in which the skill will be performed, target behavior, and level of proficiency/time frame. Sample template for IEP structure: When given [grade level and tool], the studentwill [observable behavior and goal] [level of proficiency and time frame]. 26
In the Chat: 2 Which option(s) are you currently using to set student goals? 27
Making Instructional Decisions for Individual Students 28
Analyzing Graphed Data After setting a goal, collecting progress monitoring data, and graphing progress monitoring data, ask the following questions to determine if a change is needed. Is the student s performance improving? Is the student s performance improving sufficiently to meet their goal? 29
Graphs: Very low scores The situation: Your student s scores are very low, close to the bottom of the graph. Consider: Are there issues with your progress monitoring measure or process?
Graphs: Highly variable scores Consider: Are there issues with your progress monitoring measure or process? Is the assessment consistently administered? Does the student s motivation or engagement vary from day to day? The situation: Your student s scores are highly variable with a lot of bounce from day to day.
Graphs: Flat trend line The situation: The trend line of your student s scores is flat or going down Consider: Has the plan been implemented as intended?
Graphs: Goal line steeper than the trend line The situation: The trend line is increasing, but it is less steep than the the goal line Consider Was the appropriate method used to set the goal? Intensifying the intervention rather than trying something new.
Graphs: Trend line steeper than goal line The situation: The trend line is steeper than the goal line. Consider: Was the original goal appropriately ambitious given the student s circumstances?
Graphs: Scores flat after change The situation: After an instructional change, progress monitoring data do not indicate an increased access to instruction Consider: Why might the original intervention have worked better for the student?
Graphs: Scores improving after change The situation: After an instructional change, the trend line is steeper than before the change was made Consider: Continue the intervention and monitor the student s progress through the end of the year.
Decision Rules for Analyzing Progress Monitoring Data 4 Point Rule Trend Line Analysis 37
The Four Point Rule If three weeks of instruction have occurred AND at least six data points have been collected, examine the four most recent data points. POSITIVE POOR QUESTIONABLE If all four are below goal line, consider adapting the intervention If the four data points are both above and below the goal line, keep collecting data and continue to monitor progress. If all four are above the goal line, increase the goal 38
Trend Line Analysis If four weeks of instruction have occurred AND at least eight data points have been collected, figure the trend of current performance and compare to goal line. POSITIVE POOR QUESTIONABLE If the student s trend line is steeper than the goal line, increase the goal (if goal is below benchmark). If the student s trend line is flatter than the goal line, consider adapting the intervention and assess fidelity. If the student s trend line and goal line are the same, keep collecting data and continue to monitor progress. 39
Want to Learn More? NCII Academic Progress Monitoring Tools Chart. These charts display expert ratings on the technical rigor of assessments. TOOL: Student Progress Monitoring Tool for Data Collection and Graphing. This tool is designed to help educators collect academic progress monitoring data across multiple measures as a part of the data-based individualization (DBI) process. GUIDE: Strategies for Setting High-Quality Academic Individualized Education Program Goals. In this guide, we explain how educators can establish IEP goals that are measurable, ambitious, and appropriate in light of the student's circumstances. 40
NCII Disclaimer This presentation was produced under the U.S. Department of Education, Office of Special Education Programs, Award No. H326Q260001. Celia Rosenquist serves as the project officer. The views expressed herein do not necessarily represent the positions or policies of the U.S. Department of Education. No official endorsement by the U.S. Department of Education of any product, commodity, service, or enterprise mentioned in this resource is intended or should be inferred. 43
NCII Contact Information www.Intensiveintervention.org ncii@air.org https://twitter.com/TheNCII https://www.youtube.com/c/NationalCenteronIntensiveIntervention 44