Understanding Psychological Research Methods
This content discusses the nature of science, the application of scientific methods in psychology, the distinction between psychology and pseudopsychology, the processes involved in conducting psychological research, and the importance of variables and operational definitions in research design.

Understanding Psychological Research Methods
PowerPoint presentation about 'Understanding Psychological Research Methods'. This presentation describes the topic on This content discusses the nature of science, the application of scientific methods in psychology, the distinction between psychology and pseudopsychology, the processes involved in conducting psychological research, and the importance of variables and operational definitions in research design.. Download this presentation absolutely free.
Presentation Transcript
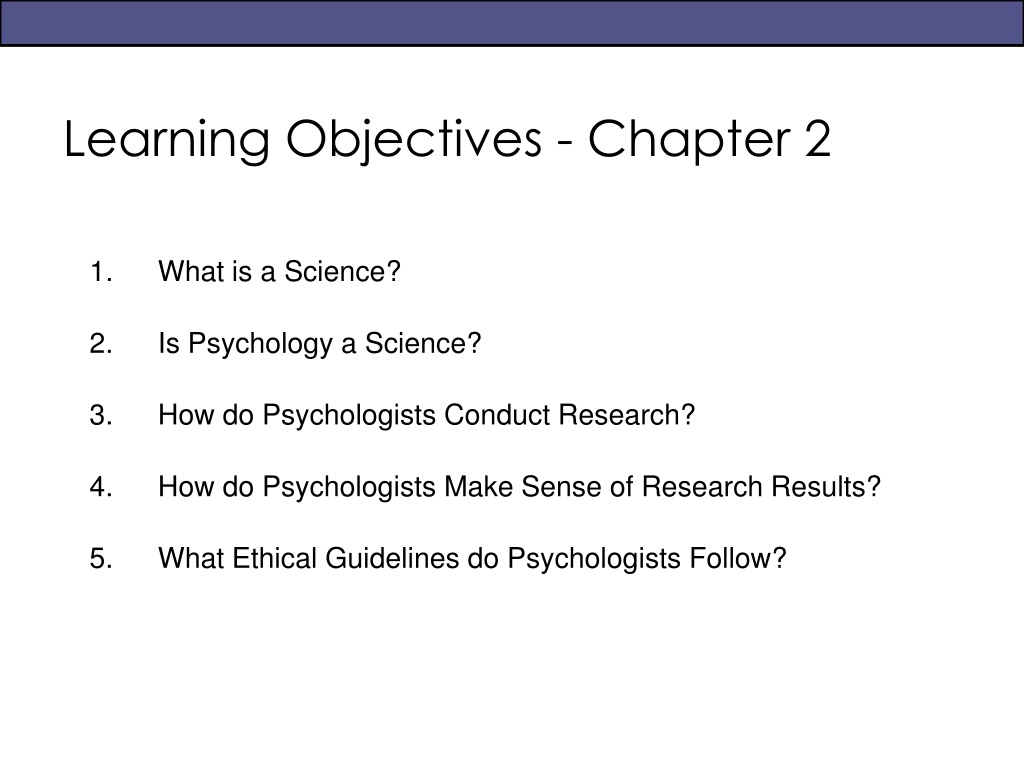
Learning Objectives - Chapter 2 1. What is a Science? 2. Is Psychology a Science? 3. How do Psychologists Conduct Research? 4. How do Psychologists Make Sense of Research Results? 5. What Ethical Guidelines do Psychologists Follow?
What Is a Science? Two core tenets of science: 1. The universe operates according to certain natural laws 2. Such laws are discoverable and testable
The Scientific Method How we Discover the Laws Governing the Universe
The Science of Psychology Psychology - Using the scientific methodto study human behaviour and mental processes Pseudopsychology (pseudoscience) - No use of the scientific method when commenting on human behaviour and mental processes Ex: parapsychology, astrology, psychics etc. James Randi - Homeopathy, quackery and fraud http://www.ted.com/talks/james_randi
How Do Psychologists Conduct Research? Developing a Question and Hypothesis
Inductive and Deductive Reasoning The scientific method uses: Inductive and deductive reasoning Hypothetico-deductive reasoning These types of reasoning help Investigators create and test hypotheses.
How Do Psychologists Conduct Research? Variables and Operational Definitions Types of Variables: Independent variable (IV) the variable that you manipulate Dependent variable (DV) the variable that you measure (or the variable that is changed by the IV)
Independent and Dependent Variables Identify the independent and dependent variables in each of the following examples: Dr. Smith examines how daily exposure to a sun lamp (1 hour of exposure or no exposure) impacts people s depression levels in the winter time.
Independent and Dependent Variables Identify the independent and dependent variables in each of the following examples: Does watching aggressive TV cartoons influence a child s level of aggressive behaviour?
Independent and Dependent Variables Identify the independent and dependent variables in each of the following examples: Does the amount of time reading this textbook (every day, once a week, or none) influence how well you will do on the exams?
Operational Definitions An operational definition is how we (the researcher) decide to measure our variables There are often hundreds of ways to measure a variable (e.g., aggression, depression) When you do research, you have to decide how you are going to measure the IV and DV
Operational Definitions Operationally define the following items: Shyness Love Memory Loss To operationally define the variable, you have to figure out how will you measure it. There is no one right answer. There are LOTS of ways to measure these items.
How Do Psychologists Conduct Research? Choosing Participants, the Research Method and Collecting Data
Choose Participants Population - The entire group that is of interest to researchers Sample - A portion of any population that is selected for the study Random selection - Randomly choosing a sample from a population Sampling bias - Choosing a sample that does not represent your population Representative sample
Choose Participants A sample or a population? Professional hockey players 10 students from VIU Albino rats 100 adults over the age of 65 This class ..it depends on ..
Two Basic Types of Research Methods Descriptive Research method used to observe and describe behaviour. Used to determine the existence of a relationship between the variables. Experimental To demonstrate a cause and effect relationships between the variables.
Descriptive and Experimental Research Applied .
Types of Descriptive Research Case studies - focuses on a single person Pitfall - Researcher bias ouija boards and facilitated communications 1. Naturalistic observation - observe people behaving as they normally do Pitfall - Hawthorne Effect you watching them will change their behavior 2. Surveys - use of a questionnaire of interview Pitfall - Participant bias I want to look good to the the researcher . 3.
Case Study An intensive study of 1 or 2 people Advantages Only method you can use if the type of behaviour you are looking at is rare Very detailed Can provide insight Disadvantages You cannot generalize your results to all people Cannot determine cause and effect
Naturalistic Observation Systematic people watching Advantages Can study things that are too unethical to do in an experiment or that people might lie about Disadvantages Time consuming Cannot determine cause and effect
Surveys Ask people directly about their behaviours Advantages Data collection is quick Cheap Disadvantages Sometimes people don t tell the truth Cannot determine cause and effect
Experimental Research Examines how one variable CAUSES another variable to change. Advantages Can establish cause and effect Can eliminate outside influences Disadvantages Might not be generalizable Sometimes unethical
Experimental and Control Group Experimental group - the group that is exposed to the IV (manipulation or treatment) Control group - the group that isn t exposed to the IV; this group is used to compare how the IV changes the DV
Experimental and Control Group Random assignment - the researcher should randomly assign who goes in which group; this should make the groups similar before the study begins How does this relate to Random Selection?
Avoiding Bias in Your Experiment Double blind procedure - neither the participant nor the researcher knows who is in which group Single Blind?
Research Design Picking a Method Do women smile more than men? Were serial killers abused as children? What type of students work out on campus? Does meditating help to reduce stress? Which type of drug (a, b, or c) helps to reduce anxiety levels?
How Do Psychologists Conduct Research? Analyzing Your Data Ben Goldacre Battling Bad Science http://www.ted.com/talks/ben_goldacre_battling_bad_science
How Do Psychologists Make Sense of Research Results? Descriptive research Describes groups or activities Correlational research - indicate if there is a relationship between the variables allow prediction but DOES NOT provide causation Experimental research - statistics indicate if the hypothesis has been supported or if there is a meaningful difference between the groups
Correlations Describe Relationships Show how two or more things are related to each other Advantages Describes how the variables are related Disadvantages Cannot determine cause and effect
Strength and Direction of a Correlational Relationship Positive correlation - when one variable increases, the other increases Negative correlation - when one variable increases the other decreases
Experimental Analyses: Cause and Effect Descriptive statistics - describe the data Mean - average of all of the scores Standard deviation - how much the participants scores vary from one another
Experimental Analyses: Cause and Effect Inferential statistics - help to draw conclusions about the data Using various statistical tests you can determine a p-value which tells you the probability that the results of your experiment are not due to chance. For example: if you have a p-value of lower than .05, that means there is less that a 5% likelihood that your results occurred by chance .ergo there is a greater than 95% chance that it occurred because of something is going on given that all was controlled the only difference that could account for the difference is .
How Do Psychologists Conduct Research? Publishing Your Work and Building a Theory
What Ethical Research Guidelines Do Psychologists Follow? Research Ethics Boards (REB) are considered the ethics police. They are a research oversight group that evaluates research to protect the rights of participants in the study.
Ethical Research Guidelines Psychologists Follow Human Research Ethical guidelines: Obtain informed consent obtaining permission from the participant after they know what the study involves and the risks and benefits of participating Protect participants from harm and discomfort
Ethical Research Guidelines Psychologists Follow Human Research Ethical guidelines: Protect confidentiality Participation must be voluntary Deception or Incomplete Disclosure Provide complete debriefing revealing to participants any information that was withheld during the study
Ethical Research Guidelines Psychologists Follow Animal Research The Canadian Council on Animal Care oversees research involving animals as subjects Animals are used only if the research promises significant benefit to humans or animals Animals are used if there is no other alternative
Ethical Research Guidelines Psychologists Follow Animal Research The Canadian Council on Animal Care oversees research involving animals as subjects Humane methods must be used The smallest number of animals possible must be used All pain and distress must be limited
Facts are stubborn, but statistics are more pliable. Mark Twain Statistics are used much like a drunk uses a lamppost: for support, not illumination Vin Scully I can prove anything by statistics except the truth. George Canning Full House = 1/694 | 5x6 (above) 1/7776 | 6x6 1/46656 2xFull House = 1/481,636
Introduction Most psychological research involves measurement; a case study of a person with multiple personalities, a naturalistic observational study of chimpanzee parental behavior in the wild, a survey study of consumer product preferences, a correlational study of the relationship between aerobic exercise and well-being, or an experimental study on the effects of mood on memory. In each case, measurement yields a set of numbers, which are the findings, or data, produced by the research study. Psychologists and other scientists summarize data, find relationships between sets of data, and determine whether experimental manipulations have had an effect on some variable of interest. INFERENTIAL STATISTICS
The word statistics has two meanings: (1) the field that applies mathematical techniques to the organizing, summarizing, and interpreting of data, and (2) the actual mathematical techniques themselves. Knowledge of statistics has many practical benefits. Even a rudimentary knowledge of statistics will make you better able to evaluate statistical claims made by science reporters, weather forecasters, television advertisers, political candidates, government officials, and other persons who may use statistics in the information or arguments they present.
Representation of Data Because a list of raw data may be difficult to interpret, psychologists prefer to represent their data in an organized way. Two of the most common ways are frequency distributions and graphs.
Graphs If a picture is worth a thousand words, then a graph is worth several paragraphs in a research report. Because it provides a pictorial representation of the distribution of scores, a graph can be an even more effective representation of research data than a frequency distribution. Among the most common kinds of graphs are pie graphs, frequency histograms, frequency polygons, and line graphs.
Pie Graph A simple, but visually effective, way of representing data is the pie graph. It represents data as percentages of a pie- shaped graph. The total of the slices of the pie must add up to 100 percent. C+ C B- C- D+ D B F B+ A+ A A-
Frequency Histogram Another approach to representing frequency data is the frequency histogram, which graphs frequencies as bars. This type of graph is called a bar graph when the underlying variable being graphed is non-continuous. For non-continuous or discrete variables (e.g., gender), the bars that are drawn don t touch. For continuous variables (e.g., weight), they do touch. In general, the scores are plotted on the abscissa (the horizontal axis) and the frequencies on the ordinate (the vertical axis). The width of the bars represents the intervals, and the height of the bars represents the frequency of scores in each interval.
Grades 18 16 14 Students 12 10 8 6 4 2 0 A+ A A- B+ B B- C+ C C- D+ D F
A+ A A- 90-100 85-89 80-84 4.33 4.00 3.67 Excellent (First Class Standing) B+ B B- C+ C C- D F 76-79 72-75 68-71 64-67 60-63 55-59 50-54 0-49 3.33 3.00 2.67 2.33 2.00 1.67 1.00 0.00 Good Satisfactory Poor Failing work Unsatisfactory performance or failure to meet course requirements.
Grades Easy Prof 56 60 64 68 72 76 80 84 88 92 96 100 Grades Mean Nasty Prof 25 35 40 50 60 70 80