2020-21 Massachusetts Public School Enrollment Insights
This data presentation offers a detailed analysis of the 2020-21 enrollment in Massachusetts public schools. It includes statewide enrollment figures, grade-specific changes, and transfer statistics for the academic year. Explore the trends and shifts in student enrollments across different categories and understand the impact on education in Massachusetts.

Download Presentation

Please find below an Image/Link to download the presentation.
The content on the website is provided AS IS for your information and personal use only. It may not be sold, licensed, or shared on other websites without obtaining consent from the author.If you encounter any issues during the download, it is possible that the publisher has removed the file from their server.
You are allowed to download the files provided on this website for personal or commercial use, subject to the condition that they are used lawfully. All files are the property of their respective owners.
The content on the website is provided AS IS for your information and personal use only. It may not be sold, licensed, or shared on other websites without obtaining consent from the author.
E N D
Presentation Transcript
2020-21 Enrollment in Massachusetts Public Schools Presented to the Board of Elementary and Secondary Education November 24, 2020
Data collection process Student data are collected via the Department s Student Information Management System (SIMS) from 400 operating school districts Utilizes the Schools Interoperability Framework (SIF) to enable a real- time data exchange between the school districts and the Department Push model as districts make changes in their student information management systems, the changes are sent to the Department Data are as of October 1, 2020, have been certified by all districts and district/school data will be made public on our website following the Board meeting today Many questions to explore; data is new 2 Massachusetts Department of Elementary and Secondary Education
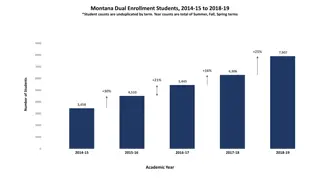
2020-21 statewide enrollment The official October 1stenrollment for the 2020-21 school year is 911,432 students in 400 school districts This is a decrease of 37,396 students or 3.9% when compared to the October 1, 2019 enrollment of 948,828 students 2017-18 2018-19 2019-20 2020-21 954,034 -- 951,631 -0.25% 948,828 -0.29% 911,432 -3.94% 3 Massachusetts Department of Elementary and Secondary Education
2020-21 enrollment by grade Significant enrollment decreases seen in pre-kindergarten and kindergarten 46% of the total statewide decrease comes from these two grades PK-K enrollment has decreased 17.9% in one year as compared to a decrease of 2.4% for grades 1-12 PK K 1 2 3 4 5 6 7 8 9 10 11 12 SP 2020 30,616 65,288 67,565 67,682 68,615 68,933 70,637 72,747 73,125 71,898 75,808 73,541 71,479 69,373 1,521 2021 21,177 57,525 63,795 65,328 65,807 67,002 67,516 69,374 71,641 72,333 73,353 72,925 71,581 70,498 1,577 % -30.8% -11.9% -5.6% -3.5% -4.1% -2.8% -4.4% -4.6% -2.0% +0.6% -3.2% -0.8% +0.1% +1.6% +3.7% Change 4 Massachusetts Department of Elementary and Secondary Education
Transfer statistics for 2020-21 Three large groupings of traditional exit and continuing education (as opposed to graduation and dropout) o Transfer to an in-state private school o Transfer out-of-state public/private o Transfer to a home school education program These transfer categories have been consistent in previous years, but changed this year 17-18 18-19 19-20 20-21 In-State Private Out of State Public/Private Home-School 8,160 7,984 7,299 13,166 12,449 12,419 12,097 12,255 820 805 802 7,188 5 Massachusetts Department of Elementary and Secondary Education
2020-21 high needs subgroups enrollment The number and percentage of English learners and students with disabilities has decreased when compared to October 1, 2019 The number and percentage of economically disadvantaged students has increased as compared to October 1, 2019 For the first time, the state is majority high needs defined as the count of students falling into one of the three subgroups English Language Learner # 97,334 99,866 102,861 95,280 Students With Disabilities # 171,061 173,843 176,741 167,310 Economically Disadvantaged # 305,203 297,120 310,873 333,829 High Needs % % % # % 17-18 18-19 19-20 20-21 10.2 10.5 10.8 10.5 17.7 18.1 18.4 18.2 32.0 31.2 32.8 36.6 449,584 458,044 466,930 469,268 46.6 47.6 48.7 50.9 6 Massachusetts Department of Elementary and Secondary Education