Analyzing Social Statistics and Data Distribution
Explore the world of social statistics, review ranges, standard deviations, variances, frequency distributions, and skewness in data analysis. Learn how to create histograms using Excel and understand the importance of charting data effectively. Discover the methods used to interpret and visualize data for better communication and decision-making.

Download Presentation

Please find below an Image/Link to download the presentation.
The content on the website is provided AS IS for your information and personal use only. It may not be sold, licensed, or shared on other websites without obtaining consent from the author. If you encounter any issues during the download, it is possible that the publisher has removed the file from their server.
You are allowed to download the files provided on this website for personal or commercial use, subject to the condition that they are used lawfully. All files are the property of their respective owners.
The content on the website is provided AS IS for your information and personal use only. It may not be sold, licensed, or shared on other websites without obtaining consent from the author.
E N D
Presentation Transcript
Review Range Standard deviation Variance Using Excel to calculate them 2
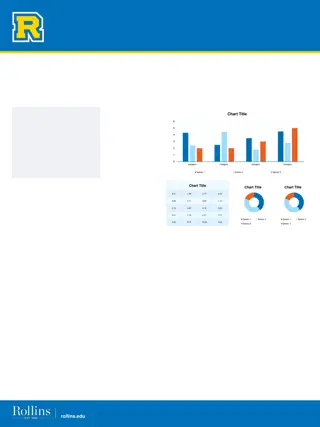
Chart Label everything One graph communicate one idea Keep things balanced Simple is best A picture is worth a thousand words 3
Frequency distribution Frequency distribution is a method to represent the frequency of certain scores. When you have a data set, such as a testing scores, Class intervals Number of intervals: 5, 10, 20 Value of interval=range/number of intervals 4
Score Exercise 16 15 19 18 16 25 25 26 26 27 29 29 28 29 27 20 21 21 21 24 24 23 20 21 20 47 2 44 41 7 6 35 38 35 36 10 11 14 14 30 30 32 33 34 32 31 31 15 16 17 50 scores Set class intervals Create a histogram using your hand Using Excel to do that 5
A histogram Histogram Chart 12 10 8 6 4 2 0 0-4 5-9 14-10 15-19 20-24 25-29 30-34 35-39 40-44 45-49 class interval 6
Excel for Histogram First, define your bins The starting point of a bin Data analysis Toolpak histogram Histogram 12 120.00% 10 100.00% 8 80.00% Frequency 6 60.00% Frequency Cumulative % 4 40.00% 2 20.00% 0 0.00% 24 29 19 34 14 39 Bin 9 44 4 49 More 7
Skewness Skewness Measure of the lack of symmetry of a distribution mean>median>mode positively skewed mean<median<mode negatively skewed 9
Skewness 10
Skewness Median for frequency distributions: N=total number of respondent (n=1414), If n=even number, n/2=707, if n= odd, (n+1)/2. So in fy column, 707 fits to 717 which has 3 siblings, so median=3. Or in c%, 50% fits to 63.2%, which is 3 siblings 11
Skewness 12
Kurtosis Kurtosis: the degree of peakedness or flatness of a probability distribution 13
Variability Variability (S-p97-Fig 4.14) 14
Frequency distribution Excel: SKEW() and KURT() Skewness characterizes the degree of asymmetry of a distribution around its mean. Positive skewness indicates a distribution with an asymmetric tail extending toward more positive values. Negative skewness indicates a distribution with an asymmetric tail extending toward more negative values. Kurtosis characterizes the relative peakedness or flatness of a distribution compared with the normal distribution. Positive kurtosis indicates a relatively peaked distribution. Negative kurtosis indicates a relatively flat distribution. 15
Exercise From General Social Survey 2010, we reported the number of children showed in the subsample of male and female respondents. Create a histogram using your hand Using Excel to do that Mean, mode and median Skewness (for more details on how to calcualte skewness, http://www.tc3.edu/instruct /sbrown/stat/shape.htm) 16 # of Children Males Females 0 1 2 3 4 94 52 71 47 30 33 92 72 127 91 38 27 447 5 or more Total(N) 327