Learn how to calculate sector angles in pie charts for representing sports preferences. Get step-by-step examples and practice problems to master the concept of determining angles in pie chart sectors. Improve your data representation skills with practical exercises.
Please find below an Image/Link to download the presentation.
The content on the website is provided AS IS for your information and personal use only. It may not be sold, licensed, or shared on other websites without obtaining consent from the author. If you encounter any issues during the download, it is possible that the publisher has removed the file from their server.
You are allowed to download the files provided on this website for personal or commercial use, subject to the condition that they are used lawfully. All files are the property of their respective owners.
The content on the website is provided AS IS for your information and personal use only. It may not be sold, licensed, or shared on other websites without obtaining consent from the author.
E N D
Presentation Transcript
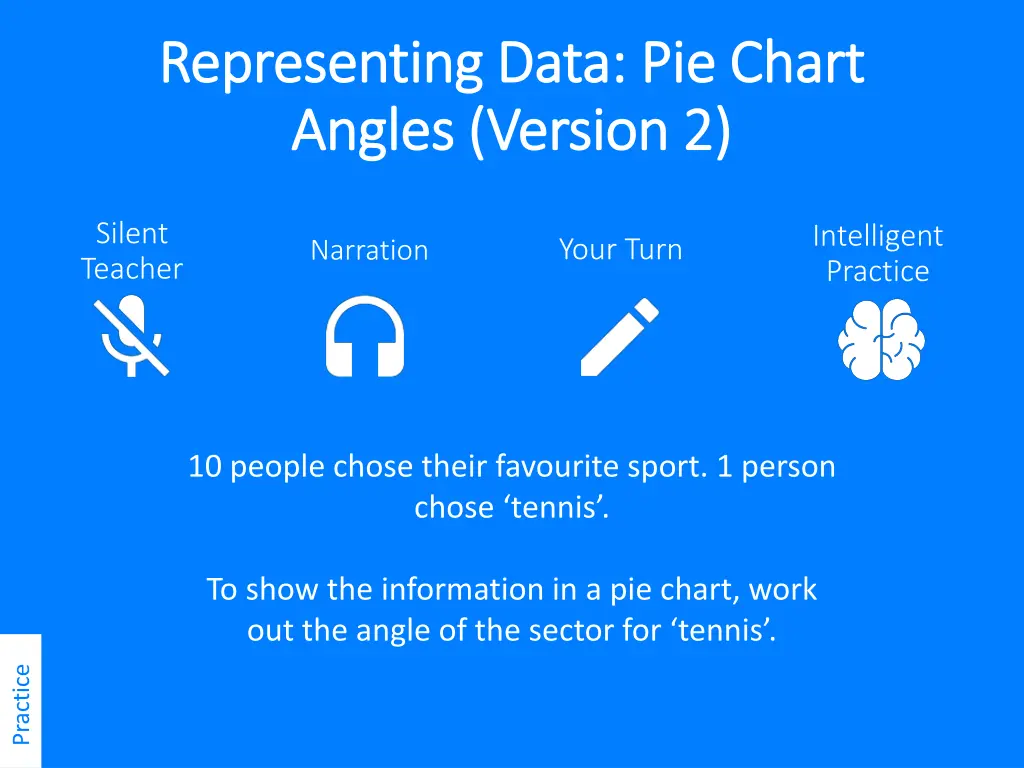
Representing Data: Pie Chart Representing Data: Pie Chart Angles (Version 2) Angles (Version 2) Silent Teacher Intelligent Practice Your Turn Narration 10 people chose their favourite sport. 1 person chose tennis . To show the information in a pie chart, work out the angle of the sector for tennis . Practice
Worked Example Your Turn 5 people chose their favourite sport. 1 person chose tennis . 10 people chose their favourite sport. 1 person chose tennis . To show the information in a pie chart, work out the angle of the sector for tennis . To show the information in a pie chart, work out the angle of the sector for tennis . 360 5 = 72 360 10 = 36 The angle sector for one person = 72 The angle sector for one person = 36
Worked Example Your Turn 5 people chose their favourite sport. 4 people chose tennis . 10 people chose their favourite sport. 4 people chose tennis . To show the information in a pie chart, work out the angle of the sector for tennis . To show the information in a pie chart, work out the angle of the sector for tennis . 360 5 = 72 360 10 = 36 The angle sector for one person = 72 The angle sector for one person = 36 36 4 = 144 72 4 = 288 The angle sector for four people = 144 The angle sector for four people = 288
3) 15 people chose their favourite sport. 3 people chose tennis . 20 people chose their favourite sport. 4 people chose tennis . 1) To show the information in a pie chart, work out the angle of the sector for tennis . To show the information in a pie chart, work out the angle of the sector for tennis . The angle sector for one person = 24 The angle sector for three people = 72 The angle sector for one person = 18 The angle sector for four people = 72 2) 20 people chose their favourite sport. 3 people chose tennis . 4) 12 people chose their favourite sport. 3 people chose tennis . To show the information in a pie chart, work out the angle of the sector for tennis . To show the information in a pie chart, work out the angle of the sector for tennis . The angle sector for one person = 18 The angle sector for three people = 54 The angle sector for one person = 30 The angle sector for three people = 90


")