Assumptions and Convergence of Evidence in Projected Classifications
Capture key concepts related to the validity period and incorporating humanitarian assistance in projected classifications for acute food insecurity. It discusses the importance of updating analyses based on changing situations and the impact of humanitarian aid on projections. The validity period depends on various factors such as seasonality and data availability, aiming to provide an accurate snapshot in time for decision-makers.

Download Presentation

Please find below an Image/Link to download the presentation.
The content on the website is provided AS IS for your information and personal use only. It may not be sold, licensed, or shared on other websites without obtaining consent from the author.If you encounter any issues during the download, it is possible that the publisher has removed the file from their server.
You are allowed to download the files provided on this website for personal or commercial use, subject to the condition that they are used lawfully. All files are the property of their respective owners.
The content on the website is provided AS IS for your information and personal use only. It may not be sold, licensed, or shared on other websites without obtaining consent from the author.
E N D
Presentation Transcript
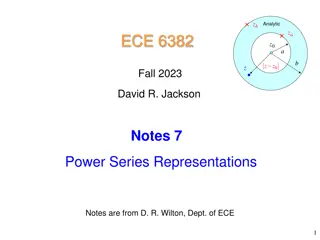
Assumptions and convergence of evidence in projected classifications. Session 3 IPC Level 1 Training IPC Acute Food Insecurity IPC Global Partners With the support of
g) Snapshot in time with validity period Classification is a picture in time of acute food insecurity that is either currently happening or projected in the future within a given time frame. Key points: Each classification has a validity period during which the situation is not expected to change significantly ? If the situation changes the analysis should be updated, or a new analysis should be conducted Validity period depends also on seasonality aspects, decision-makers needs, expected data availability etc. Validity period can vary from a few weeks up to a year as long as the food security situation within that period is expected to remain relatively similar
g) Snapshot in time with validity period (cont.) For example For example If the coming food insecurity situation is If the coming food insecurity situation is expected to behave like this . expected to behave like this . More Severe Expected Severity of Acute Food Insecurity Optimally we would have two projections Optimally we would have two projections Projected with Projected with Validity Period May Validity Period May to Jul to Jul Projected with Projected with Validity Period Aug Validity Period Aug to Oct to Oct Current with Validity Current with Validity Period from Jan to Period from Jan to Apr Apr Reporting on Reporting on peak of lean peak of lean season season reporting reporting on peak on peak of start of start of lean of lean season season Less reporting on situation as reporting on situation as seen at time of analysis seen at time of analysis Severe May Dec Mar Nov Aug Feb Sep Apr Oct Jun Jan Jan Jul What we should not do is to have only one projection from May to Oct! What we should not do is to have only one projection from May to Oct!
h) Incorporating humanitarian assistance Current classification is a snapshot in time with any potential effects of humanitarian assistance. Projection classification includes any expected effects of likely humanitarian food assistance Key points: Population in Phase 3+ does not necessarily reflect the total population in need of assistance as some households may be in lower Phases due to receiving assistance and may be in need of continued action Humanitarian food assistance considered for projections should be regular or inter- annual, and any other assistance that is planned, funded or likely to be funded and delivered during the projection period Newly appealed for assistance is not considered in the projection analysis
j) Projection classifications Projected classifications are based on the expected population likely to be in different severity Phases, incorporating the effects of any planned humanitarian food assistance Key points: Based on a good understanding of current and historical conditions and forecast based on a set of clear assumptions on the evolution of the conditions ? Consider aggravating and mitigating factors that may have already happened or are most likely to happen Identifies those most likely to experience food gaps or who may be able to meet minimum food needs but only by engaging in livelihood coping strategies Based on the most likely scenario, including any planned, funded or likely to be funded and delivered humanitarian food assistance Population in Phase 3 or more severe refers to those in need of urgent action (despite any potential assistance that is expected to be delivered) Projections can be updated when assumptions made earlier do not hold Updates can be done without direct evidence on outcomes and can only extend until the end of the existing validity period
j) Projection classifications (cont.) Start by Current Classification Relying on normal trends and assumptions for upcoming trends, infer expected outcome indicators whenever historical/baseline evidence is available (e.g. HEA, FCS, rCSI, GAM) Relying on the whole body of evidence, project severity of the situation Is the projection situation likely to be more severe, similar, or better than the current situation? Is the situation likely to change by a Phase, or are populations going to move between Phases without changing the classification? For example For example Current Phase in all areas is... Phase 3 Analysts conclude that situation will remain in Phase 3 in projection period, with more households facing Phase 3 and 4 conditions
j) Projection classifications (cont.) Remember to observe the 20% rule of classification Clearly label the table and add a disclaimer For example For example Projected Number of People in Need (from xxx to xxx 2019) A population in Phase 3+ reflect those that will be in need of urgent action to decrease food consumption gaps and save lives and livelihoods in the most likely scenario.
Projected Classifications Step 8: Develop assumptions for future shocks and ongoing conditions Relevance: To provide analysts with expected outlook of the key factors to be considered when projecting the severity and magnitude of future acute food insecurity. Approach Overview: Describe key assumptions on impacts of shocks and ongoing conditions that are likely to affect food security in projected period considering: Seasonal/usual events and unusual shocks likely to happen Positive and negative shocks Events that have already happened or will likely happen The assumptions formulated in Step 8 will be used in Steps 9 and 10 as the basis of projection analysis Preferably to be completed before workshop and reviewed by the Analysis Team during the workshop 8
Projected Classifications Step 8: Develop assumptions for future shocks and ongoing conditions (cont.) The logical process of making assumptions How does food security normally behave in the projected period? How will shocks and anomalies [or will not] impact the normal trend of food security (positively and/or negatively)? Usually stocks run out by the last months of the projected period and households rely on purchases, wild foods, casual labour and hunting. Past analysis shows that even in normal years about 20% of HHs go into Phase 2 or more severe during this time. The low production (70% below 5 years avg.) means that HHs will run of stocks much earlier at least 4 months earlier. The prices are expected to increase up to 100% and casual labour opportunities are also expected to be lower than normal, as HHs are recovering from their losses. As planting starts in this period, forecasts for the next rainy season will also impact on casual labour opportunities. For now, it is assumed that next rainy season will be close to average and thus some casual labour opportunities will be available. Preferably to be completed before workshop and reviewed by the Analysis Team during the workshop 9
For Projected Classification Step 8 in ISS: Assumptions for Projections Identify topic of assumption Drop down menu Other > Specify Brief Description Free text for a reasoning of what is expected to happen with issue Conclude if the issue is expected to have a mitigating or an aggravating influence on food security during projected period.
Projected Classifications Step 9: Analyse evidence Relevance: To organize, evaluate and analyse evidence on forecasting of most likely future conditions of food security elements, taking into account their current levels, historical trends, past and most likely future impacts of shocks Approach Overview: Assess projected trends based on current conditions and context, historical trends and assumptions prepared in Step 8 Provide conclusions for the elements, including reference to evidence and critical reasoning. As much as possible conclude if elements are likely to improve, remain similar or deteriorate compared to current situation 11
Projected Classifications CURRENT CLASSIFICATION FINISHED START OF PROJECTIONS Step 9: Analyse evidence for projection (cont.) The logical process of preparing projections Is it possible to know by how much? Based on assumptions agreed, will this issue improve, remain the same or deteriorate? Using the agreed upon assumptions about crop production, food prices, labor opportunities, and wages, the size of the gap can be estimated for different wealth groups. In this case, the Outcome analysis suggests that during the peak of the lean season, the poor (35% of HHs) will face survival deficits equivalent to Crisis (Phase 3), while the middle wealth group (40% of HHs) will face livelihood protection deficits equivalent to Stressed (Phase 2). These findings point to a Phase 3 classification with at least 35% of population in Phase 3. Food consumption is likely to deteriorate substantially from current as HHs run out of stocks, prices increase and casual labour opportunities are limited. Preferably to be completed before workshop and reviewed by the Analysis Team during the workshop 12
For Projected Classification Step 9 in ISS: Analyze evidence for Projection Layout similar to Step 3 (Current Classification): Organized into two tabs Sub-divided into Food Security Elements Call for Evidence Statement Free text: Content of statements need to forecast most likely changes DC and Reliability Call for Conclusions Categorical (how projected situation is likely to compare to current) Indicative Phase Classification Narrative (as relevant and feasible)
Projected Classifications Step 10: Determine area classification and population estimates Relevance: To provide a critical review of supporting and contradictory evidence used to arrive at Phase classification and estimation of number and percentage of people in different Phases Approach Overview: Distribute the proportion of households in each Phase Conclude on area classification Provide conclusion for final classification Assign evidence level of classification 14
Projected Classifications Step 10: Area classification & pop. estimates Distribute the proportion of households in each Phase Good practice 1: Review expected trend of elements Based on analysis of current conditions, assumptions and historical trends Stocks to run out Less wild foods as dry season approaches Markets to have especially staples Own stocks of most HHs to run out, especially those of poor and middle WGs Income sources to be limited Prices to increase by 100% Deteriorate Significantly Food Availability Deteriorate Significantly Food Access Food UtilizationAccess to water to decrease only slightly because of high reliance on tap water Feeding and caring practices to remain similar Food Consumption likely more than 40-50% Households likely to start engaging in crisis strategies. The poor may resort to emergency strategies. Given that 10% of HHs were engaging in crisis and emergency strategies after the harvest (current), it is expected that at least 20- 40% engage in these during projection, especially accounting for the 30% of poor population Remain similar Food consumption to deteriorate significantly, by at least more than 20% but Deteriorate Significantly Livelihood Change Deteriorate Significantly To be completed by the Analysis Team during workshop 15
Projected Classifications Step 10: Area classification & pop. estimates Distribute a proportion of households in each Phase Good practice 2: Conclude how populations will likely move between and within Phases Assess current population estimates, analysis of projected elements and livelihood groups Phase 5: - No households are expected to go into Catastrophe due to social mitigating factors, wild foods and available livelihood assets. Phase 4: - Those who were in Phase 4 in current period are likely to continue to be in Phase 4 (5%) - Livelihood group analysis: Most of the poor (about 10% of total pop) with limited income and very low food production will likely be in Phase 4. In addition the poorest (5%) who lost all production and do not have alternative sources of income are likely to remain in Phase 4. As a result the total population in Phase 4 is expected to be 15% - Area -based analysis: Some of those who were in Phase 3 will move into Phase 4 and this deterioration may be between 20-40%. As current pop in Phase 3 is 25%, between 5 and 10% may move from Phase 3 to 4. - Overall conclusion: Phase 4 expected to increase from 5 to 10% Phase 3: - Phase 3 current will either move into Phase 4 or remain in Phase 3. If 10% move to Phase 4, 15% will remain. - Some of those who were in Phase 2 after harvest will continue to be in Phase 2 and some will move to Phase 3. Given that most HHs are expected to run out of stocks 4-6 months earlier than normal, the expected high price of food and the limited casual labour at least 30-50% of HHs currently in Phase 2 will move into Phase 3. And so on 16 To be completed by the Analysis Team during workshop
For Projected Classification Step 10: Determine area classification and population estimates for Projections Similar to Step 4 (Current Classification): Estimation of population in each Phase (only % in each Phase manually entered)
www.IPCinfo.org The End IPC Global Partners With the support of

 Snapshot in time with validity period")
 Snapshot in time with validity period (cont.)")
 Incorporating humanitarian assistance")
 Projection classifications")
 Projection classifications (cont.)")
 Projection classifications (cont.)")