Comparison of NRTI Combinations: ZDV/3TC vs. TDF+/FTC Studies Review
Explore the findings from studies such as ACTG A5202 and ASSERT comparing NRTI combinations ZDV/3TC versus TDF+/FTC, along with insights from Studies HEAT, 934, and GS-US-292-0104. Learn about the efficacy and safety profiles of these regimens in HIV treatment, with a focus on Study 292-0102's comparison of EVG/c/FTC/TAF.QD vs EVG/c/FTC/TDF.QD, including virologic efficacy, resistance profiles, and adverse events.

Uploaded on | 1 Views
Download Presentation

Please find below an Image/Link to download the presentation.
The content on the website is provided AS IS for your information and personal use only. It may not be sold, licensed, or shared on other websites without obtaining consent from the author. If you encounter any issues during the download, it is possible that the publisher has removed the file from their server.
You are allowed to download the files provided on this website for personal or commercial use, subject to the condition that they are used lawfully. All files are the property of their respective owners.
The content on the website is provided AS IS for your information and personal use only. It may not be sold, licensed, or shared on other websites without obtaining consent from the author.
E N D
Presentation Transcript
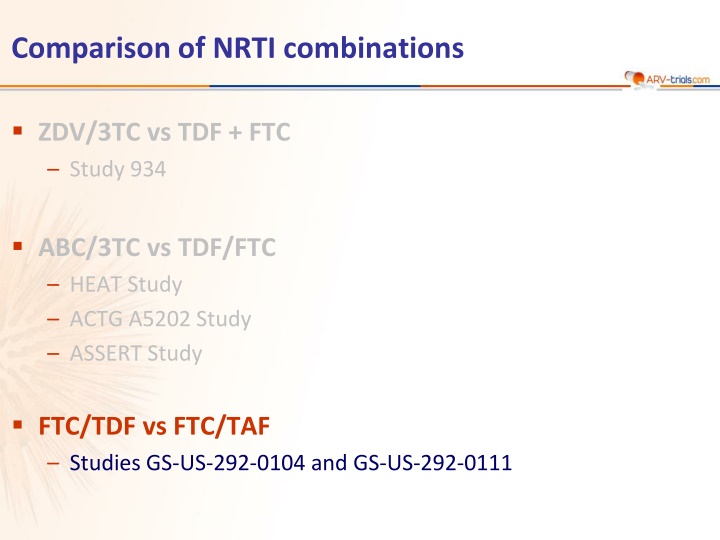
Comparison of NRTI combinations ZDV/3TC vs TDF + FTC Study 934 ABC/3TC vs TDF/FTC HEAT Study ACTG A5202 Study ASSERT Study FTC/TDF vs FTC/TAF Studies GS-US-292-0104 and GS-US-292-0111
Study 292-0102: EVG/c/FTC/TAF QD vs EVG/c/FTC/TDF QD (Phase 2) Design Randomisation* 2 : 1 Double-blind W24 W48 EVG/c/FTC/TAF 150/150/200/10 mg QD STR N = 112 > 18 years ARV-na ve EVG/c/FTC/TDF placebo HIV RNA > 5,000 c/mL CD4 cell count > 50/mm3 eGFR > 70 mL/min EVG/c/FTC/TDF 150/150/200/300 mg QD STR EVG/c/FTC/TAF placebo N =58 *Randomisation was stratified by HIV RNA (< or > 100,000 c/mL) at screening Primary objective Determine virologic efficacy of EVG/c/FTC/TAF 150 patients provide 76% power to detect a 1.5% (SD of 3.3%) difference in hip bone mineral density in the EVG/c/FTC/TAF arm relative to the EVG/c/FTC/TDF arm Sax PE. JAIDS 2014;67:52-8 2920102/TAF phase 2
Study 292-0102: EVG/c/FTC/TAF QD vs EVG/c/FTC/TDF QD (Phase 2) Baseline characteristics Median viral load at baseline : 4.6 log10c/mL (21% > 100,000 c/mL), median CD4+ cell count : 391 cells/mm3(15% > 200/mm3) Main results Discontinuation due to adverse events by W48 : 4 in TAF arm vs 0 in TDF arm HIV RNA < 50 c/mL at W24 : 87.5% E/c/F/TAF vs 89.7% E/c/F/TDF 3 patients in each arm met criteria for resistance testing (virologic failure [2 consecutive HIV RNA > 50 c/mL] with HIV RNA > 400 c/mL). Genotype was performed on confirmatory sample E/c/F/TAF : no resistance detected E/c/F/TDF : 2 patients developed resistance, 1 to NRTI, 1 to INSTI + NRTI PK substudy : plasma TFV exposure was 91% lower with E/c/F/TAF than with E/c/F/TDF, as measured by AUCtau. Conversely, intracellular TFV-DP levels in PBMCs were 5.3-fold higher with E/c/F/TAF Sax PE. JAIDS 2014;67:52-8 2920102/TAF phase 2
Study 292-0102: EVG/c/FTC/TAF QD vs EVG/c/FTC/TDF QD (Phase 2) Safety Significantly less change in the E/c/F/TAF arm in BMD at hip (-0.62% vs -2.39%, p < 0.001) and lumbar spine (-1.0% vs -3.37%, p < 0.001) at W48, which were also significant at week 24 In the E/c/F/TAF arm, 32% of patients had no decrease in hip BMD vs 7% in the E/c/F/TDF arm (p < 0.001) Median change in eGFR by Cockcroft Gault = -5.5 mL/min for E/c/F/TAF vs -10.1 mL/min for E/c/F/TDF (p = 0.041) Renal tubular proteinuria [urine retinol-binding protein/creatinine ratio and urine -2 microglobulin/creatinine ratio] was significantly lower in patients who received E/c/F/TAF : no cases of proximal tubulopathy Grade 3-4 adverse events : 9.8% TAF vs 5.2% TDF Most common treatment-emergent adverse events : nausea (21% vs 12%), diarrhea (16% in each arm) Higher elevations in lipids with TAF Sax PE. JAIDS 2014;67:52-8 2920102/TAF phase 2
Study 292-0102: EVG/c/FTC/TAF QD vs EVG/c/FTC/TDF QD (Phase 2) Grade 3 or 4 laboratory abnormalities E/C/F/TAF E/C/F/TDF Any 25% 17% LDL-cholesterol 9% 3% Creatine phosphokinase 6% 3% Neutropenia 5% 2% Amylase 3% 3% Urine red blood cells 2% 0 Total cholesterol 2% 0 ALT / AST 1% / 1% 2% / 0 Gamma glutamyl transferase 1% 2% White blood cells 1% 0 Hypophosphatemia 1% 0 Urine protein 1% 0 Glucose 1% 2% Triglycerides 1% 2% Sax PE. JAIDS 2014;67:52-8 2920102/TAF phase 2
Study 292-0102: EVG/c/FTC/TAF QD vs EVG/c/FTC/TDF QD (Phase 2) Summary of week 48 results In this phase 2, randomised clinical trial, HIV-positive treatment-naive adults received STRs of E/c/F/TAF or E/c/F/TDF. Both STRs demonstrated high and comparable rates of virologic suppression through 48 weeks of therapy Both regimens were well tolerated, with few discontinuations due to adverse events. Nausea occurred more frequently with E/c/F/TAF Plasma concentrations of TFV were substantially (91%) lower with E/c/F/TAF than with E/c/ F/TDF, and the TAF regimen delivered 5.3 times the intracellular, physiologically active metabolite, TFV-DP, to PBMCs, which could translate into less end-organ toxicity and/or improved virologic control Significant smaller decreases in bone mineral density through 48 with E/c/F/TAF than with E/c/F/TDF Urinary RBP/creatinine and -2 microglobulin/creatinine ratios were significantly lower in the E/c/F/TAF arm, which suggests that TAF has a lesser effect than TDF on the proximal renal tubular cell Sax PE. JAIDS 2014;67:52-8 2920102/TAF phase 2