Economic Development and Environmental Trends: A Global Analysis
Explore the relationships between population growth, economic production, energy use, and environmental impact from 1961 to 2019 through captivating visual representations. Dive into economic growth patterns, carbon dioxide emissions, air pollution exposure, and chlorofluorocarbon production worldwide.
Download Presentation

Please find below an Image/Link to download the presentation.
The content on the website is provided AS IS for your information and personal use only. It may not be sold, licensed, or shared on other websites without obtaining consent from the author. If you encounter any issues during the download, it is possible that the publisher has removed the file from their server.
You are allowed to download the files provided on this website for personal or commercial use, subject to the condition that they are used lawfully. All files are the property of their respective owners.
The content on the website is provided AS IS for your information and personal use only. It may not be sold, licensed, or shared on other websites without obtaining consent from the author.
E N D
Presentation Transcript
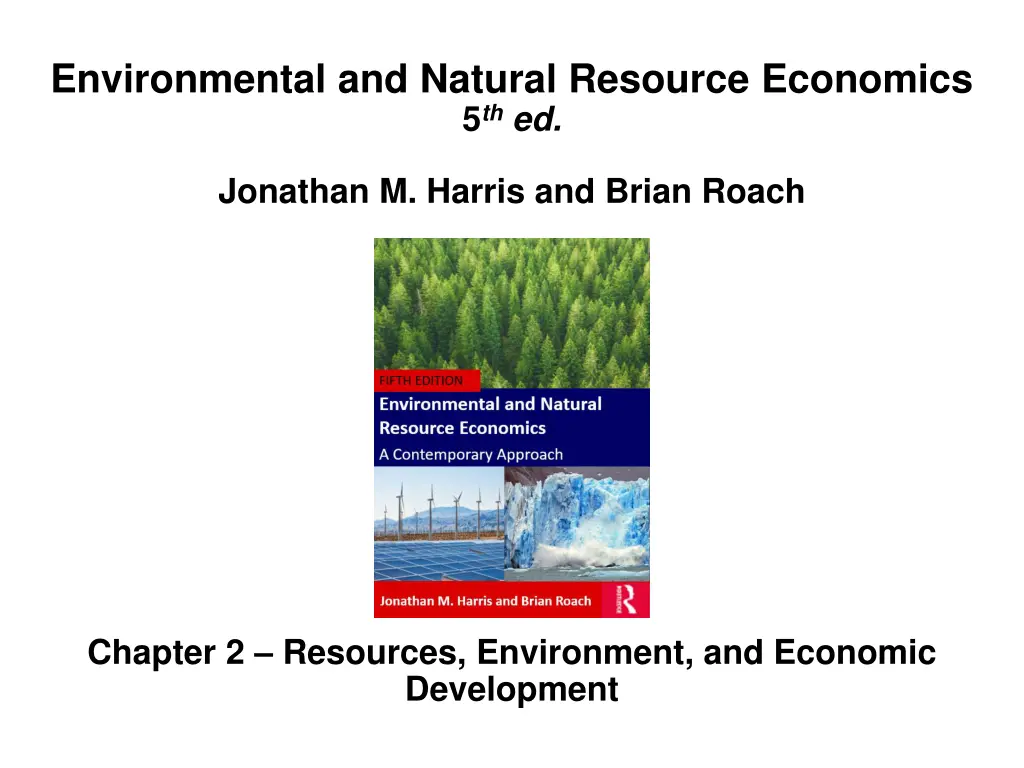
Environmental and Natural Resource Economics 5th ed. Jonathan M. Harris and Brian Roach Chapter 2 Resources, Environment, and Economic Development
Figure 2.1: Growth in Population, Food Production, Economic Production, and Energy Use, 1961-2019 8 7 6 Index (1961=1) 5 4 3 2 1 0 Population Food Production Gross World Product Energy Sources: Population, food production, and gross world product from the World Bank, World Development Indicators database; energy data from the U.S. Energy Information Administration, International Energy Statistics. Most recent food production data from FAO (FAOSTAT) and most recent energy data from BP (BP Statistical Review of World Energy).
Figure 2.2: Economic Growth, 1961-2019, by Country Income Category 50,000 45,000 GDP per Capita, 2010 US Dollars 40,000 35,000 30,000 25,000 20,000 15,000 10,000 5,000 0 1960 1970 1980 1990 2000 2010 2020 Low Middle High Source: World Bank, World Development Indicators database.
Figure 2.3: Global Carbon Dioxide Emissions, 1960-2018, by Country Income Category 40 35 Million Tons of Carbon Dioxide 30 25 20 15 10 5 0 1960 1970 1980 1990 2000 2010 2020 Low Lower Middle Upper Middle High World Sources: World Bank, World Development Indicators database (for data up to 2016); global and national data for 2017 and 2018 from the International Energy Agency, with author s estimated allocations into country income groups.
Figure 2.4 Average Exposure to Particulate Matter Air Pollution, Selected Countries, 2017 100 90 Average Annual Exposure ( g/m3) 80 70 60 50 40 30 20 10 0 Source: World Bank, World Development Indicators database.
Figure 2.5: Global Production of Chlorofluorocarbons, 1980-2018 1,200 1,000 Thousand Tons 800 600 400 200 0 1980 1985 1990 1995 2000 2005 2010 2015 2020 Sources: Alternative Fluorocarbons Environmental Acceptability Study, www.afeas.org/index.html;Domonoske, Camila. 2018. Banned Ozone-Depleting Chemical Is Still Being Produced Somewhere, Scientists Say. NPR, May 17, 2018. .
Figure 2.6 Living Planet Index, 1970-2016 1.2 Living Planet Index (1970=1) 1.0 0.8 0.6 0.4 0.2 0.0 1970 1980 1990 2000 2010 2020 Source: Zoological Society of London and WWF, http://stats.livingplanetindex.org/.
Figure 2.7: Net Change in Forest Area, by Region and Time Period Net Change (million hectares per year) -5 -4 -3 -2 -1 0 1 2 3 Asia Europe North and Central America South America Africa 1990-2000 2000-2010 2010-2020 Source: Food and Agriculture Organization of the United Nations (FAO),2020. Global Forest Resources Assessment 2020: Key Findings.
Figure 2.8 World Water Withdrawals, Actual and Projected, by Sector 5000 4500 4000 Billion Cubic Meters 3500 3000 2500 2000 1500 1000 500 0 2014 Agriculture 2025 2040 Municipal Industry Energy Source: International Energy Agency (IEA) and Organisation for Economic Co-operation and Development (OECD), Water-Energy Nexus, excerpt from the World Energy Outlook 2016.
Figure 2.9 Growth of Global Chemicals Production, 1990 2019, with projection to 2030 400 Production Index (1990=100) 350 300 250 200 150 100 50 0 1990 2000 2010 2020 2030 Source: UN Environment. 2019c. Global Chemicals Outlook II: From Legacies to Innovative Solutions. Note: Chart based on global production of basic petrochemical building blocks, including ethylene, propylene, butadiene, benzene, toluene and xylenes.


