Energy Consumption Trends in U.S. Industrial Sector
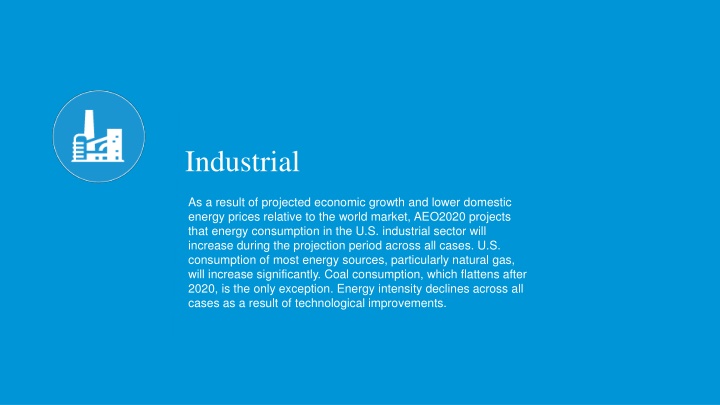
The U.S. industrial sector is projected to experience an increase in energy consumption, driven by economic growth and lower domestic energy prices relative to the global market. Various energy sources will be utilized, with natural gas showing significant growth. Energy intensity is expected to decrease due to technological advancements. Different scenarios like High Economic Growth and Low Economic Growth cases impact industrial energy consumption differently. Overall, the industrial sector's energy demand is forecasted to rise across all cases.

Download Presentation

Please find below an Image/Link to download the presentation.
The content on the website is provided AS IS for your information and personal use only. It may not be sold, licensed, or shared on other websites without obtaining consent from the author.If you encounter any issues during the download, it is possible that the publisher has removed the file from their server.
You are allowed to download the files provided on this website for personal or commercial use, subject to the condition that they are used lawfully. All files are the property of their respective owners.
The content on the website is provided AS IS for your information and personal use only. It may not be sold, licensed, or shared on other websites without obtaining consent from the author.
E N D
Presentation Transcript
Industrial As a result of projected economic growth and lower domestic energy prices relative to the world market, AEO2020 projects that energy consumption in the U.S. industrial sector will increase during the projection period across all cases. U.S. consumption of most energy sources, particularly natural gas, will increase significantly. Coal consumption, which flattens after 2020, is the only exception. Energy intensity declines across all cases as a result of technological improvements. U.S. Energy Information Administration U.S. Energy Information Administration #AEO2020 www.eia.gov/aeo
U.S. Energy Information Administration U.S. Energy Information Administration #AEO2020 www.eia.gov/aeo
Consumption of delivered industrial energy grows in all AEO2020 cases AEO2020 industrial delivered energy consumption quadrillion British thermal units 2019 High Economic Growth 45 history projections 40 High Oil and Gas Supply Low Oil Price Reference High Oil Price Low Oil and Gas Supply Low Economic Growth 35 30 25 20 // 15 0 2000 2010 2020 2030 2040 2050 U.S. Energy Information Administration U.S. Energy Information Administration 3 #AEO2020 www.eia.gov/aeo
driven by economic growth, but it is also affected by low prices and resource availability In the AEO2020 Reference case, U.S. delivered energy consumption in the industrial sector grows 36% from 26 quadrillion British thermal units (Btu) to 36 quadrillion Btu during the projection period. Industrial activity is closely correlated with economic activity. Therefore, changes in assumptions related to economic growth affect industrial sector energy consumption the most. The High Economic Growth case and the Low Economic Growth case vary the most from AEO2020 reference case projections of U.S. industrial sector energy consumption. Through the late 2020s, the High Oil Price case projects the fastest growth in industrial sector energy demand as a result of increased investment in the short term for more mining/oil extraction equipment and related activities (construction, cement, steel for drilling equipment, etc.). Eventually, higher oil prices dampen consumer spending in the long run, thereby lowering growth. Over the long term, industrial energy consumption is highest in the High Economic Growth case, reaching 45 quadrillion Btu in 2050, a 69% increase from 2019. With a faster growing economy, greater industrial activity in sectors such as food and fabricated metal products increases industrial energy use. Energy consumption in the High Oil and Gas Supply case is greater than in the Reference case as a result of increased crude oil and natural gas resources and improved extraction technologies that increase energy demand in the mining industry. U.S. Energy Information Administration U.S. Energy Information Administration 4 #AEO2020 www.eia.gov/aeo
Industrial sector energy consumption increases fastest for natural gas and hydrocarbon gas liquids in the AEO2020 Reference case Industrial energy consumption by energy source and subsector (AEO2020 Reference case) quadrillion British thermal units 2019 projections 2019 projections 40 40 35 35 non- manufacturing non-energy- intensive other energy- intensive bulk chemical feedstocks 30 30 25 25 natural gas 20 20 hydrocarbon gas liquids 15 15 petroleum 10 10 bulk chemicals heat and power refining renewables purchased electricity coal 2050 5 5 0 0 2015 2025 2035 2045 2050 2015 2025 2035 2045 U.S. Energy Information Administration U.S. Energy Information Administration 5 #AEO2020 www.eia.gov/aeo
and bulk chemicals and nonmanufacturing are the fastest-growing industries in the sector Total U.S. industrial delivered energy consumption grows 1.0% per year on average during the projection period in the AEO2020 Reference case. Growth varies by fuel. EIA projects coal consumption to decline through the projection period, while natural gas and hydrocarbon gas liquids (HGL) consumption will grow fastest, reflecting strong supply growth and relatively low prices. During the projection period, industrial sector HGL consumption grows by 1.4% per year and natural gas consumption grows by 1.1% per year, as these fuels become more heavily used for heat and power and as feedstocks. Energy consumption in the bulk chemicals industry, including both heat and power and feedstocks, accounts for about 35% of total U.S. industrial energy consumption by the end of the projection period and grows at 1.6% per year. Energy consumption in the other energy-intensive industries in the United States remains relatively flat during the projection period, growing on average 0.3% per year. Energy consumption in the iron and steel industry declines by 19% during the projection period, energy consumption in the paper industry increases by 11%, and energy consumption in the cement and lime industry consumption stays relatively flat. U.S. Energy Information Administration U.S. Energy Information Administration 6 #AEO2020 www.eia.gov/aeo
In the AEO2020 Reference case, energy intensities decline in most heavy industries Energy intensity by subsector (AEO2020 Reference case) trillion British thermal units per billion 2012 dollar shipments Energy-intensive manufacturing (AEO2020 Reference case) trillion British thermal units per billion 2012 dollar shipments cement and lime 2019 2050 total industry bulk chemical feedstocks iron and steel manufacturing glass energy-intensive manufacturing paper bulk chemical heat and power non-energy intensive manufacturing refining aluminum 2019 2050 non-manufacturing food 0 5 10 15 20 25 0 2 4 6 8 U.S. Energy Information Administration U.S. Energy Information Administration 7 #AEO2020 www.eia.gov/aeo
reflecting industrial capital stock turnover and adoption of new, more energy-efficient technologies Energy intensity in the U.S. industrial sector (energy consumption per dollar of output) declines by 0.4% per year on average through 2050 in the AEO2020 Reference case. In manufacturing, energy intensity declines 0.5% per year through the projection period as a result of the increased energy efficiency of new capital equipment and the faster growth rate in non-energy-intensive manufacturing industries relative to energy-intensive manufacturing industries. Energy intensities in the refining sector and in the bulk chemical heat and power sector both increase as relatively low-cost natural gas increases production of lower-value commodities. Higher energy intensities in the refining sector and bulk chemical sector are offset by efficiency improvements in other energy-intensive industries, such as food (0.7% per year decline in energy intensity), glass (0.8% decline per year), and cement and lime (1.3% decline per year). The net result is an overall 2% decline in energy intensity for the energy-intensive manufacturing industries sector during the projection period. For some industries, large amounts of combined heat and power generation (CHP) may mask some efficiency gains. EIA includes CHP generation losses in industry energy consumption. Purchased electricity generation losses are accounted for in the electricity sector. U.S. Energy Information Administration U.S. Energy Information Administration 8 #AEO2020 www.eia.gov/aeo
AEO2020 Reference case energy consumption by fuel varies across energy-intensive industries Energy consumption by energy source shares and industry (AEO2020 Reference case) percent food 2019 2050 glass aluminum bulk chemicals including feedstocks iron and steel paper agriculture refining 0% 25% 50% 75% 100% natural gas distillate and residual fuel oils coal purchased electricity petroleum products hydrocarbon gas liquids/propane renewables U.S. Energy Information Administration U.S. Energy Information Administration #AEO2020 www.eia.gov/aeo 9
because some industries have greater capacity for fuel switching than others Natural gas (used primarily for process heat) remains the primary fuel in the U.S. food and glass industries in the AEO2020 Reference case, although its share declines through 2050. In the food industry, the share of renewables grows from 14% in 2019 to 20% in 2050. In the glass industry, natural gas continues to have the largest share, retaining more than an 88% share through the projection period. In the U.S. iron and steel industry, coal remains the primary fuel, although its share in the total energy mix for the sector declines from 50% in 2019 to 44% in 2050 as natural gas and electricity-fueled technologies become more widely used. The bulk chemicals industry consumes natural gas and HGLs for both heat and power and feedstock. The relatively low projected prices for both fuels result in continued high shares of total energy consumption and reduced shares of purchased electricity as CHP adoption grows. In the United States, in addition to the food industry and, to some extent, refining (where bio-based feedstocks are used to produce blend- stocks for the transportation fuels sector), one of the highest shares of renewables consumption is in the paper industry, where black liquor (a byproduct of the pulping process) serves as a major fuel for boilers and on-site CHP. The renewables share of total energy consumed in the paper industry increases from 61% in 2019 to 68% in 2050. Petroleum remains the primary fuel for refining and for agriculture, where distillate fuels most of the on-field equipment. U.S. Energy Information Administration U.S. Energy Information Administration 10 #AEO2020 www.eia.gov/aeo
Self-generation from combined heat and power (CHP), especially for bulk chemicals, accounts for most AEO2020 Reference case growth in industrial sector electricity consumption CHP generation and purchased electricity consumption for U.S. industries with the most installed CHP (AEO2020 Reference case) Purchased electricity consumption billion kilowatthours CHP generation billion kilowatthours 2019 2019 projections 300 300 projections 250 250 200 200 bulk chemicals 150 150 100 bulk chemicals refining 100 50 50 refining paper paper 0 0 2050 2015 2025 2035 2045 2050 2015 2025 2035 2045 U.S. Energy Information Administration U.S. Energy Information Administration 11 #AEO2020 www.eia.gov/aeo
as quantities of purchased electricity remain fairly flat AEO2020 Reference case electricity generation from CHP units in the U.S. bulk chemicals, refining, and paper industries (industries with the most CHP) grows 1.5% per year, from 125 billion kilowatthours (kWh) in 2019 to 196 billion kWh in 2050. The bulk chemical, refining, and paper industries use the most CHP in the United States because these large industries have high heating needs, and steam is readily available onsite to use for generation. The share of self-generated electricity to total electricity consumption in the sector rises from 34% in 2019 to 42% in 2050 because rapidly growing demand for industrial heat allows complementary power generation growth. Although natural gas accounts for more than 90% of the fuel used for CHP in the bulk chemicals industry in 2019 and 95% in 2050, petroleum products in the form of residual oil, petroleum coke, and still gas and others fuel some of the CHP capacity in the refining sector. In the paper industry, renewables such as black liquor fire CHP generation. U.S. Energy Information Administration U.S. Energy Information Administration 12 #AEO2020 www.eia.gov/aeo
In the bulk chemicals industry, combined-heat-and-power (CHP) adoption grows in the AEO2020 Reference case; sales to the grid remain relatively flat as most generation fuels onsite consumption Net CHP generation and disposition in the bulk chemicals sector, by fuel (AEO2020 Reference case) billion kilowatthours 2019 projections 2019 projections 140 140 120 120 100 100 consumed onsite 80 natural gas 80 60 60 40 40 sales to the grid petroleum coal other 20 20 0 0 2015 2025 2035 2045 2050 2050 2015 2025 2035 2045 U.S. Energy Information Administration U.S. Energy Information Administration 13 #AEO2020 www.eia.gov/aeo


,")