Forecasting Seasonal Data Analysis
Seasonal data analysis plays a crucial role in forecasting trends for various products and commodities. This involves identifying patterns in pricing, production, and demand that repeat over certain time periods. By incorporating seasonal variables into forecasting models, businesses can better predict fluctuations in prices and quantities, helping them make informed decisions. Explore the uses of seasonal models, steps for estimating seasonal indices, and different econometric models for forecasting seasonal patterns in this comprehensive guide.

Download Presentation

Please find below an Image/Link to download the presentation.
The content on the website is provided AS IS for your information and personal use only. It may not be sold, licensed, or shared on other websites without obtaining consent from the author. If you encounter any issues during the download, it is possible that the publisher has removed the file from their server.
You are allowed to download the files provided on this website for personal or commercial use, subject to the condition that they are used lawfully. All files are the property of their respective owners.
The content on the website is provided AS IS for your information and personal use only. It may not be sold, licensed, or shared on other websites without obtaining consent from the author.
E N D
Presentation Transcript
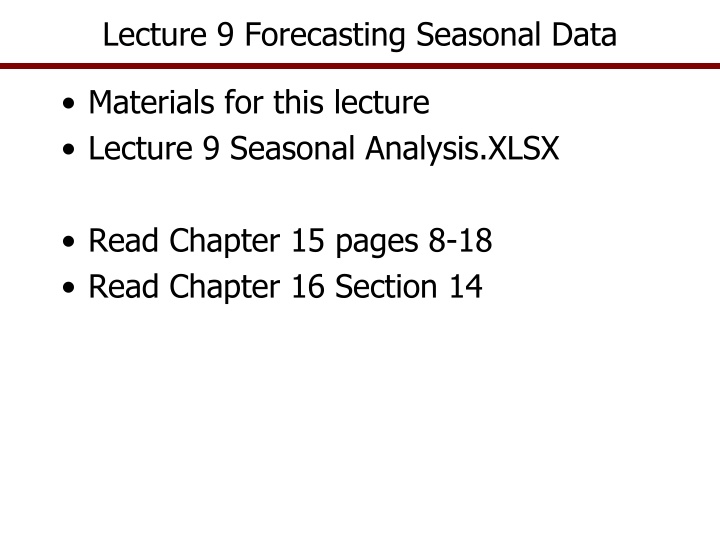
Lecture 9 Forecasting Seasonal Data Materials for this lecture Lecture 9 Seasonal Analysis.XLSX Read Chapter 15 pages 8-18 Read Chapter 16 Section 14
Uses for Seasonal Models Have you noticed a difference in prices from one season to another? Tomatoes, avocados, grapes, lettuce Wheat, corn, hay 450-550 pound Steers Gasoline Many price series have seasonal patterns To forecast seasonal data you must explicitly incorporate variables in the model to pick up the seasonality
Seasonal and Moving Average Forecasts Monthly, weekly and quarterly data generally have a seasonal pattern Annual data have cycles Seasonal patterns repeat each year due to Seasonal production due to climate or weather Seasonal demand (holidays, summer, etc.) Cycle may also be present and the seasonal pattern is mapped over the top of the cycle if you are using many years of monthly data
Seasonal and Moving Average Forecasts Example of monthly prices showing seasonal variability on top of a multi year cycle
Econometric Models for Forecasting Seasonal Patterns Seasonal indices Composite forecast models Dummy variable regression model Harmonic regression model Moving average model
Steps for Estimating a Seasonal Index Graph the data Check for a trend and seasonal pattern Develop and use a seasonal index if no trend is present If a trend is present, forecast the trend and combine it with a seasonal index Develop a composite forecast model Trend and seasonal components
Two kinds of Seasonal Indices Price Index The traditional index value shows the relative relationship of price between months or quarters It is ONLY used with price data Fractional Contribution Index If the variable is a quantity, calculate a fractional contribution index to show the relative contribution of each month to the annual total quantity It is ONLY used with quantities
Seasonal Index Model Seasonal index is a simple way to forecast a monthly or quarterly data series Index represents the fraction that each month s price or sales is above or below the annual mean If the seasonal index for June is 1.10 it means the June price averages 110% of the annual average price If the seasonal index for December is 0.85 it means the December price averages 85% of the annual average price A function in Simetar estimates the seasonal index for time series with a few simple steps, so it is very easy to use this type of forecasting model
Seasonal Index Model Estimated by Simetar Years 1 2 3 4 5 6 7 8 9 10 11 12 1 2 3 4 5 6 7 8 9 71.06 65.12 66.88 83.66 89.13 89.85 96.25 87.44 88.63 89.57 82.45 56.9 71.99 90.83 79.465 93.675 97.72 1400.62 1442.835 82.38941 84.87265 85.51412 86.33618 84.41206 83.82235 83.65824 81.96265 80.27735 79.60382 80.19235 81.41412 11.57589 11.9041 12.96476 14.22 12.60769 13.73284 12.45774 11.46838 11.57323 10.96217 10.82638 11.95711 0.994 1.024 1.032 1.042 1.019 1.011 0.083 0.085 0.086 0.087 0.085 0.084 0.719 0.749 0.735 0.719 0.726 0.690 1.270 1.299 1.329 1.365 1.311 1.333 71.47 65.25 72.6 70.06 62.72 73.66 88.3 90.5 95.13 102.75 91.15 94.35 92.4 78.88 56.49 81.49 91.86 84.405 96.125 103.47 1453.74 1467.715 1435.005 70.31 59.15 75.43 89.75 88.25 95.25 103.3 93.88 98.32 91.88 78.19 54.94 85.48 89.43 86.25 100.36 107.545 68.75 60.19 76.38 89.5 88.4 95.8 103.19 67.08 64.8 64.5 77.53 81.5 93.83 94.38 99.63 89.25 96.34 84.34 71.83 62.67 86.63 72.92 83.04 100 63.12 65.25 81.5 84.1 90.7 99.2 92.94 88.01 95.07 83.1 67.4 63.94 82.98 70.915 81.215 87.925 59.44 66.13 85.4 84.25 86.5 94.75 92.19 85.75 90.5 79.32 63.94 64.7 78.81 87.5 66.62 64.94 80.71 85.7 85.1 91.88 89.38 84.25 86.5 77.85 62.5 62.31 79.14 70.445 84.18 96.63 95.135 1363.27 64.12 64.68 79.5 85.33 88.08 98.17 88.25 84.13 87.67 80.08 61.5 63.01 81.32 72.835 90.25 98.975 96.14 1384.04 60 75.63 82.8 92.83 94.63 102.69 89.4 96.45 88 90.88 89.63 101.75 87.69 92.88 89.5 80.51 60.07 75.8 93.17 84.82 94.99 103.825 87 93.3 91.85 85.44 88.82 76.57 63.5 59.14 78.79 71.63 80.805 90.31 91.16 90 97.44 87.55 75.9 58.3 85.15 83.85 81.755 93.265 99.585 10 11 12 13 14 15 16 17 84 73.87 57.28 86.6 77.815 81.16 95.245 107.5 1424.98 65 60.47 84 67.275 81.52 87.22 99 96 95 1422.19 1393.365 1364.715 1353.265 SUM AVERAGE ST DEV INDEX FRAC. CONT. INDEX INDEX LCI INDEX UCI 1.009 0.084 0.718 1.301 0.989 0.082 0.715 1.263 0.969 0.081 0.686 1.251 0.961 0.080 0.691 1.230 0.968 0.081 0.703 1.232 0.982 0.082 0.695 1.270 0.944 0.083 0.952 0.083 0.989 0.089 0.997 0.089 1.023 0.088 1.031 0.087 1.110 0.083 1.119 0.083 1.034 0.083 1.042 0.083 1.033 0.086 1.041 0.086 0.991 0.084 0.999 0.084 0.938 0.081 0.946 0.081 0.999 0.080 1.008 0.080 0.928 0.077 0.935 0.077 0.944 0.081 0.952 0.081 0.969 0.086 0.977 0.086 STOCHASTIC INDICES STOCHASTIC FRACTIONAL INDICES ADJ.STOCH.INDICES ADJ.STOCH.FRACTIONAL INDICES
Using a Seasonal Price Index for Forecasting Seasonal index has an average of 1.0 Use seasonal index to forecast monthly prices from annual average price forecast PJan = Annual Avg Price * IndexJan PMar = Annual Avg Price * IndexMar Assume you have a trend forecasted annual average price of $125, you can develop monthly forecasts using the seasonal price indices, as: Jan Price = $125 * 0.600 = $75.0 Mar Price = $125 * 0.976 = $122.0 The forecast can include risk by using a stochastic forecast of annual price
Seasonal Fractional Contribution Index Fractional Contribution Index sums to 1.0 to represent 100% of annual quantity of sales Each month s value is the fraction of total sales that month Use a trend or structural model to forecast annual sales SalesJan = Total Annual Sales * IndexJan SalesJun = Total Annual Sales * IndexJun For an annual sales forecast at 340,000 units SalesJan = 340,000 * 0.050 = 17,000.0 SalesJun = 340,000 * 0.076 = 25,840.0 This forecast is useful for input procurement and inventory management The forecast can include risk by using a stochastic forecast of annual sales
Seasonal Forecast Using Dummy Variable Models Dummy variable regression model can forecast trend and seasonal varibility Include a trend if one is present Regression model to be estimated is: = a + b1Jan + b2Feb+ +b11Nov + b13T + b14Z Jan Nov are individual dummy variable 0 s and 1 s Effect of Dec is captured in the intercept If the data are quarterly, use 3 dummy variables, for first 3 quarters and intercept picks up affect for fourth quarter = a + b1Qt1 + b2Qt2 + b11Qt3 + b13T+ b14Z NOTE: the Z variable represents other structural variables that can be included in the model
What is Each Part of the Equation Doing? = a + b1Jan + b2Feb+ +b11Nov + b13T + b14Z The a intercept is capturing the average value of Y when all the other variables are zero The b1 through b11 are capturing the effects of different months on the Y variable, some may be positive and others negative. Some may not be statistically significant but should be left in the model for completeness The T variable is trend and effectively de-trends the data prior to estimating the seasonal effects The Z variable represents other structural variables that can be included in the model, such as income, population, own price and competing prices
Seasonal Forecast with Dummy Variable Models Set up the X matrix with 0 s and 1 s Easy to forecast as the seasonal effect is assumed to persist forever Note the pattern of 0s and 1s for months December affect is captured in the intercept
Seasonal Forecast with Dummy Variable Models Regression Results for a Monthly Dummy Variable Model May not have a statistically significant effect for each month, as indicate by the Student t on the betas Monthly forecasts use beta for the month being forecasted Jan forecast = 45.93+4.147 * (1) +1.553*T -0.017 *T2 +0.0001 * T3 May forecast = 45.93 + 4.999 * (1) +1.553*T -0.017 *T2 +0.0001 * T3
Probabilistic Monthly Forecasts In this case we use the Adjusted Stochastic Indices at the bottom of the Simetar output
Probabilistic Monthly Forecasts Develop probabilistic forecast of the annual price In this case I used a trend forecast of the annual average prices and forecasted the value for year 18 Use the stochastic Indices to simulate stochastic monthly forecasts
Harmonic Regression for Seasonal Models Add Sin and Cos functions in OLS regression to isolate seasonal variation Define a variable SL to represent alternative seasonal lengths: 2, 3, 4, Create the X Matrix for OLS regression X1 = Trend so it is: T = 1, 2, 3, 4, 5, . X2 = Sin(2 * i() * T / SL) X3 = Cos(2 * i() * T / SL) Fit the regression equation of: i = a + b1T + b2 Sin((2 * i() * T) / SL) + b3 Cos((2 * i() * T) / SL) + b4T2 + b5T3 Only include b1T if a trend is present
Harmonic Regression for Seasonal Models This is what the X matrix looks like for a Harmonic Regression
Harmonic Regression for Seasonal Models Note that the COS term is not statistically significant, but it MUST be included when using the model to forecast SIN and COS are creating the wave effect in the forecast T is creating the positive trend in the forecast The model needs more terms to capture the underlying cycle
Moving Average Forecasts Moving average forecasts are used by the industry as the naive forecast If you can not beat the MA then you can be replaced by a simple MA forecast Calculate a MA of length K periods and move the average each period, drop the oldest and add the newest value 3 Period MA 4 = (Y1 + Y2 + Y3) / 3 5 = (Y2 + Y3 + Y4) / 3 6 = (Y3 + Y4 + Y5) / 3
Moving Average Forecasts Example of a 12 Month MA model estimated and forecasted with Simetar Change Periods value to test alternative MA lengths MA with lowest MAPE is best but still leave a couple of periods, 3 is probably the minimum
Probabilistic Moving Average Forecasts Use the MA model with lowest MAPE but with a reasonable number of periods (min of 3) If the no. periods is to short soon you are using forecasted values to forecast more forecasted values Assume your last real value is denoted as T, then a forecast for period T+5 is using all forecasted values given a 4 period moving average T+5 = (YT+1 +YT+2 + YT+3 + YT+4)/4
Probabilistic Forecast for Seasonal Models Stochastic simulation used to develop a probabilistic forecast for a random variable i = NORM( i , ) i is the forecast for each future period based on your expectations of the exogenous variables for future periods is a constant and is calculated as the std dev of the residuals