Learn about the process of rectification and image analysis in satellite image processing. Dr. Aurass Muhi Taha explains the importance of geometric corrections to ensure accurate measurements and comparisons of digital remotely sensed images. Understand the role of ground control points, resampling, and image rectification in transforming real world coordinates to image coordinates.
Please find below an Image/Link to download the presentation.
The content on the website is provided AS IS for your information and personal use only. It may not be sold, licensed, or shared on other websites without obtaining consent from the author. If you encounter any issues during the download, it is possible that the publisher has removed the file from their server.
You are allowed to download the files provided on this website for personal or commercial use, subject to the condition that they are used lawfully. All files are the property of their respective owners.
The content on the website is provided AS IS for your information and personal use only. It may not be sold, licensed, or shared on other websites without obtaining consent from the author.
E N D
Presentation Transcript
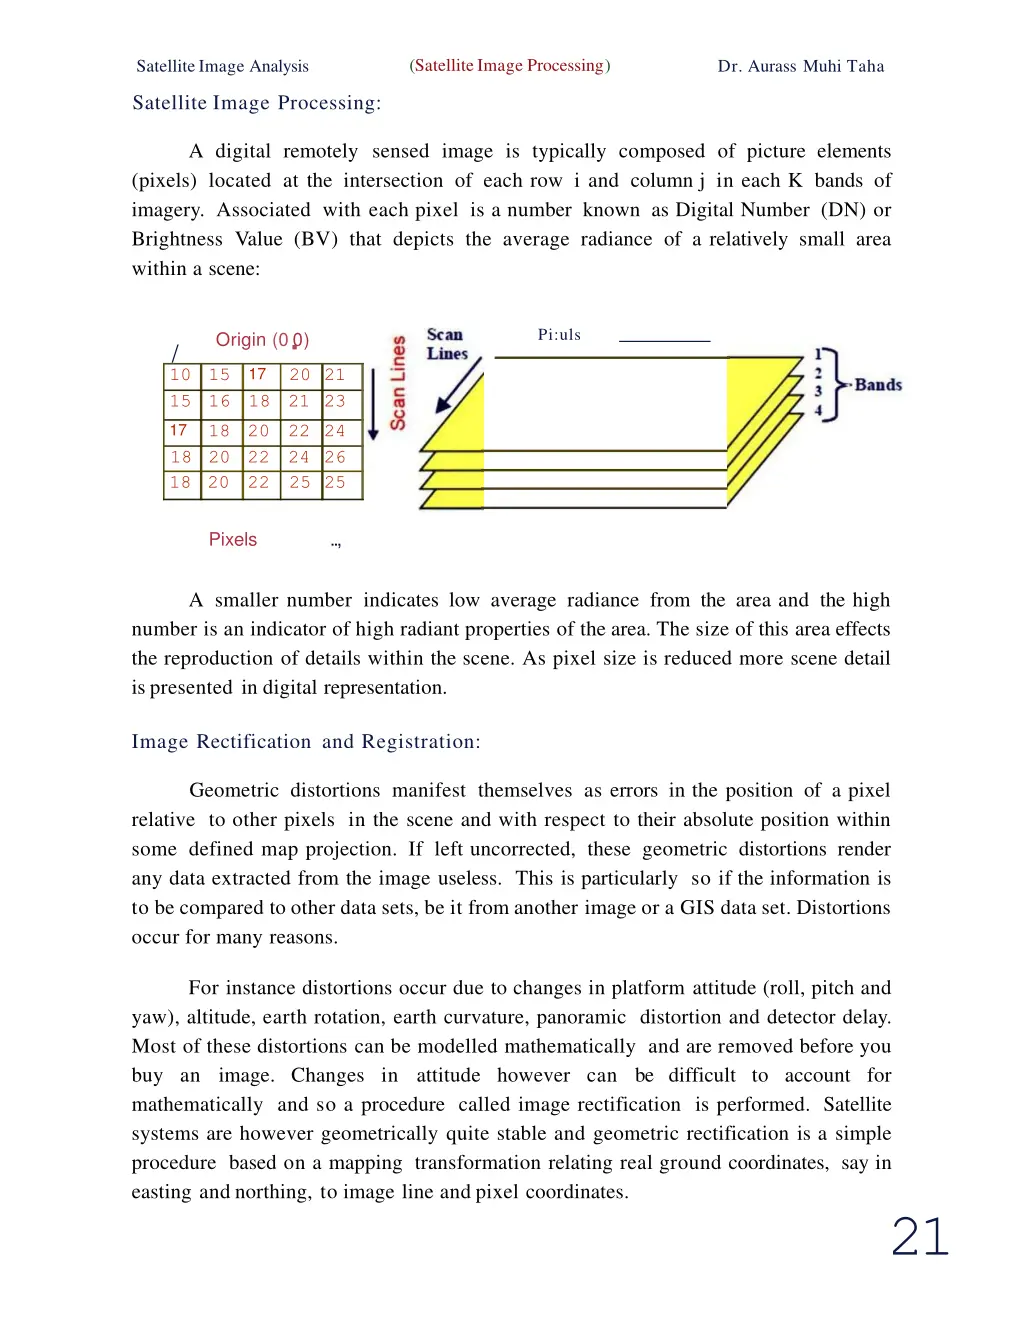
(SatelliteImage Processing) SatelliteImage Analysis Dr. Aurass Muhi Taha Satellite Image Processing: A digital remotely sensed image is typically composed of picture elements (pixels) located at the intersection of each row i and column j in each K bands of imagery. Associated with each pixel is a number known as Digital Number (DN) or Brightness Value (BV) that depicts the average radiance of a relatively small area within a scene: Origin (0.0) 15 17 16 18 18 20 18 20 18 20 Pi:uls / 10 15 20 21 21 23 22 24 24 26 25 25 17 22 22 Pixels .., A smaller number indicates low average radiance from the area and the high number is an indicator of high radiant properties of the area. The size of this area effects the reproduction of details within the scene. As pixel size is reduced more scene detail is presented in digital representation. Image Rectification and Registration: Geometric distortions manifest themselves as errors in the position of a pixel relative to other pixels in the scene and with respect to their absolute position within some defined map projection. If left uncorrected, these geometric distortions render any data extracted from the image useless. This is particularly so if the information is to be compared to other data sets, be it from another image or a GIS data set. Distortions occur for many reasons. For instance distortions occur due to changes in platform attitude (roll, pitch and yaw), altitude, earth rotation, earth curvature, panoramic distortion and detector delay. Most of these distortions can be modelled mathematically and are removed before you buy an image. Changes in attitude however can be difficult to account for mathematically and so a procedure called image rectification is performed. Satellite systems are however geometrically quite stable and geometric rectification is a simple procedure based on a mapping transformation relating real ground coordinates, say in easting and northing, to image line and pixel coordinates. 21
(Satellite Image Processing) SatelliteImage Analysis Dr. Aurass Muhi Taha Rectification is a process of geometrically correcting an image so that it can be represented on a planar surface, conform to other images or conform to a map: GCP 4-- (B) (A) (D) (C) That is, it is the process by which geometry of an image is made planimetric. It is necessary when accurate area, distance and direction measurements are required to be made from the imagery. It is achieved by transforming the data from one grid system into another grid system using a geometric transformation. Rectification is not necessary if there is no distortion in the image. For example, if an image file is produced by scanning or digitizing a paper map that is in the desired projection system, then that image is already planar and does not require rectification unless there is some skew or rotation of the image. Scanning and digitizing produce images that are planar, but do not contain any map coordinate information. These images need only to be geo-referenced, rectification. In many cases, the image header can simply be updated with new map coordinate information. This involves redefining the map coordinate of the upper left comer of the image and the cell size (the area represented by each pixel). which is a much simpler process than Ground Control Points (GCP) are the specific pixels in the input image for which the output map coordinates are known. By using more points than necessary to solve the transformation equations a least squares solution may be found that minimizest h e 22
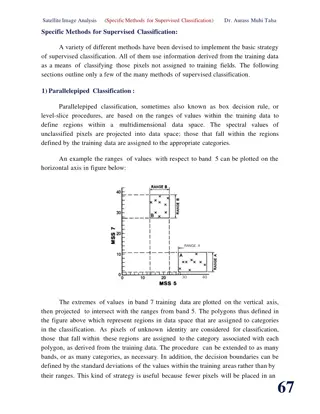
(Satellite Image Processing) Dr. Aurass Muhi Satellite Image Analysis Taha sum of the squares of the errors. Care should be exercised when selecting ground control points as their number, quality and distribution affect the result of the rectification. Once the mapping transformation has been determined a procedure called resampling is employed. Resampling matches the coordinates of image pixels to their real world coordinates and writes a new image on a pixel by pixel basis. Since the grid of pixels in the source image rarely matches the grid for the reference image, the pixels are resampled so that new data file values for the output file can be calculated. In some situations, spacecraft velocity departs from nominal values, as the ground track covered by a given number of successive mirror producing along track scale distortion. The magnitude of correction is 1.5 km. If the spacecraft velocity deviates from the nominal, the ground track covered by a fixed number of successive mirror sweeps, changes. This causes a cross scans scale distortion. This kind of distortion may be corrected , on the basis of the following model: sweeps, changes Where: X3 =actual ground track, X2=nominal ground track, ctv =normalized spacecraft velocity error and v =spacecraft nominal velocity. v Image Enhancement Techniques: Image enhancement techniques improve the quality of an image as perceived by a human. These techniques are most useful because many satellite images when examined on a colour display give inadequate information for image interpretation. There is no conscious effort to improve the fidelity of the image with regard to some ideal form of the image. There exists a wide variety oftechniques for improving image quality. The contrast stretch, density slicing, edge enhancement, and spatial filtering are the more commonly used techniques. Image enhancement is attempted after the image is corrected for geometric and radiometric distortions. Image enhancement methods are applied separately to each band of a multispectral image. Digital techniques have been found to be most satisfactory than the photographic technique for image enhancement, because ofthe precision and wide variety of digital processes. Contrast: Contrast generally refers to the difference in luminance or grey level values in an image and is an important characteristic. It can be defined as the ratio of the23
(Satellite Image Processing) Satellite Image Analysis Taha Dr. Aurass Muhi maximum intensity to the minimum intensity over an image. Contrast ratio has a strong bearing on the resolving power and detectability of an image. Larger this ratio, more easy it is to interpret the image. Satellite images lack adequate contrast and require contrast improvement. Contrast enhancement techniques expand the range of brightness values in an image so that the image can be efficiently displayed in a manner desired by the analyst. The density values in a scene are literally pulled farther apart, that is, expanded over a greater range. The effect is to increase the visual contrast between two areas of different uniform densities. This enables the analyst to discriminate easily between areas initially having a small difference in density. 1) Linear Contrast Stretch: this is the simplest contrast stretch algorithm. The grey values in the original image and the modified image follow a linear relation in this algorithm. A density number in the low range of the original histogram is assigned to extremely black and a value at the high end is assigned to extremely white. The remaining pixel values are distributed linearly between these extremes. The features or details that were obscure on the original image will be clear in the contrast stretched image. Linear contrast stretch operation can be represented graphically as shown in below: Histogram of low contrast image Transformation Histogram of min-max linearcontrast stretched iamge 255 255 >. I ) c: >. I ) c: -' >'S a:l cr u. i... u. 0 4 255 0 0 BVout 0 (a) \ (a) Histogam 1 8 2&5 Imagevalues (ON) I 0 I I I l I II I (b) Nostretch 0 2 '5 Displaylevels (ON) 00 1&8 I ImagevalUes (ON) Displaylevels (ON) 24
(Satellite Image Processing) Dr. Aurass Muhi Taha Satellite Image Analysis To provide optimal contrast and colour variation in colour composites the small range of grey values in each band is stretched to the full brightness range of the output or display unit. 2) Non-Linear Contrast Enhancement: In these methods, the input and output data values follow a non-linear transformation. The general form of the non-linear contrast enhancement is defined by y = f (x), where x is the input data value and y is the output data value. The non-linear contrast enhancement techniques have been found to be useful for enhancing the colour contrast between the nearly classes and subclasses of a main class. A type of nonlinear contrast stretch involves scaling the input data logarithmically. This enhancement has greatest impact on the brightness values found in the darker part of histogram. It could be reversed to enhance values in brighter part of histogram by scaling the input data using an inverse log function. Histogram equalization is another non-linear contrast enhancement technique. In this technique, histogram of the original image is redistributed to produce a uniform population density. This is obtained by grouping certain adjacent grey values. Thus the number of grey levels in the enhanced image is less than the number of grey levels in the original image. Radiometric Correction: The primary function of remote sensing data quality evaluation is to monitor the performance ofthe sensors. The performance ofthe sensors is continuously monitored by applying radiometric correction models on digital Image data sets. The radiance measured by any given system over a given object is influenced by factors, such as, changes in scene illumination , atmospheric conditions, viewing geometry and instrument response characteristics. One of the most important radiometric data processing activity involved in many quantitative applications of digital image data is conversion of digital numbers to absolute physical reflectance. values namely, radiance and The digital numbers have been directly used by some investigators to statistically classify cover types in a single image, identify map terrain features, and create continuous images for digital mosaic of several images or ratio spectral bands to eliminate differential illumination effects. The results of such analyses are questionable because the digital numbers do not quantitatively represent any real physical feature. 25
(Satellite Image Processing) Dr. Aurass Muhi Taha Satellite Image Analysis It is therefore necessary to first convert the digital data into physically meaningful values such as radiance and reflectance so that they can be used in further analysis. The metadata of the satellite images is presented in MIL file. The first step of the proposed work is to convert the DN (Digital Number) values of band to at-sensor spectral radiance using the following equation: L = (Lmax - Lmin) * Qcal + L . _ Q. A ( ) t mtn Qcalmax - Qcalmin Where: L,t = spctral radince at the sensor's apeture ( ) W m2srf1m Lmax = is the maximum radiance (wm-2sr-1f1m-1 , ) Lmin = is the minimum radiance (Wm-2sr-1f1m-1 , ) Qcal = is the DN value of pixle, Qcalmax =is the maximum of DN value of pixie, Qcalmin = is the minimum of DN value of pixie and Oi = is the correction value for band Spatial Filtering: A characteristic of remotely sensed images is a parameter called spatial frequency defined as number of changes in Brightness Value per unit distance for any particular part of an image. If there are very few changes in Brightness Value once a given area in an image, this is referred to as low frequency area. Conversely, if the Brightness Value changes dramatically over short distances, this is an area of high frequency. Spatial filtering is the process of dividing the image into its constituent spatial frequencies, and selectively altering certain spatial frequencies to emphasize some image features. This technique increases the analyst's ability to discriminate detail. The three types of spatial filters used in remote sensor data processing are: Low pass filters, Band pass filters and High pass filters. Image enhancements that de-emphasize or block the high spatial frequency detail are low-frequency or low-pass filters. The simplest low-frequency filter evaluates a particular input pixel brightness value, BV in, and the pixels surrounding 26
(Satellite Image Processing) Dr. Aurass Muhi Satellite Image Analysis Taha the input pixel, and outputs a new brightness value, BVout , that is the mean of this convolution. The size of the neighbourhood convolution mask or kernel (n) is usually 3x3, 5x5, 7x7, or 9x9. The simple smoothing operation will, however, blur the image, especially at the edges of objects. Blurring becomes more severe as the size of the kernel increases. Using a 3x3 kernel can result in the low-pass image being two lines and two columns smaller than the original image. Techniques that can be applied to deal with this problem include: 1)Artificially extending the original image beyond its border by repeating the original border pixel brightness values or 2)Replicating the averaged brightness values near the borders , based on the image behavior within a view pixels of the border. The most commonly used low pass filters are mean, median and mode filters. High-pass filtering is applied to Imagery to remove the slowly varymg components and enhance the high-frequency local variations. Brightness values tend to be highly correlated in a nine-element window. Thus, the high frequency filtered image will have a relatively narrow intensity histogram. This suggests that the output from most high-frequency filtered images must be contrast stretched prior to visual analysis. Edge Enhancement in the Spatial Domain For many remote sensing earth science applications, the most valuable information that may be derived from an image is contained in the edges surrounding various objects of interest. Edge enhancement delineates these edges and makes the shapes and details comprising the image more conspicuous and perhaps easier to analyze. Generally , what the eyes see as pictorial edges are simply sharp changes in brightness value between two adjacent pixels. The edges may be enhanced using either linear or nonlinear edge enhancement techniques. Linear Edge Enhancement A straightforward method of extracting edges in remotely sensed imagery is the application of a directional first-difference algorithm and approximates the first derivative between two adjacent pixels. The algorithm produces the first difference of the image input in the horizontal, vertical , and diagonal directions. The Laplacian operator generally highlights point , lines, and edges in the image and suppresses uniform and smoothly varying regions. Human vision physiological research suggests that we see objects in much the same way. Hence, the use of this operation has a more natural look than many of the other edge-enhanced images. 27
(SatelliteImage Processing) SatelliteImage Analysis Dr. Aurass Muhi Taha Atmospheric Cm..-ection: The energy recorded by a sensor is always modified by the atmosphere between the sensor and the ground. As shown as shown in below: ,..,0- "'-\ I / \::!Sensor P E T (5)Tolal radiancet.,..= --;- +L,. Path radiance LP Skylight ET (3) Reflected energy L 1t (1) Incident radiation E (withattenuation factor) - The atmosphere influences the radiance recorded by a sensor in two ways, namely, (a) it attenuates or reduces the energy illuminating a ground object and (b) the atmosphere acts as a reflector itself adding the path radiance to the signal detected by the sensor. These two atmospheric effects are expressed mathematically as follows: (2) Terrain element of refleclance p NR>vAM>wmJI(J(JI(IQII(AA \ - pET Ltot = - - + Lp TC Where: Ltot =Total spectral radiance measured by the sensor, Lp=Path radiance from the atmosphere, p=Reflectance of object, E=Irradiance on object or incoming energy and T=Transmitted energy. The irradiance (E) is caused by directly reflected 'sunlight' and diffused 'skylight,' which is the sunlight scattered by the atmosphere. The amount of irradiance depends on seasonal changes, solar elevation angle, and distance between the earth and sun. Atmospheric Correction by FLAASH model Signals recorded by sensor contain noise and not the ground surface value due to atmospheric effects such as scattering, absorption and path radiance while signal transmitting in atmosphere. It's essential to remove the noise and correct atmospheric 28
(Satellite Image Processing) Dr. Aurass Muhi Taha Satellite Image Analysis effects, especially, for multi-temporal degradation monitoring and classification. land use/cover change analysis and land FLAASH (Fast Line-of-sight Atmospheric Analysis of Spectral Hypercubus) Model employs the MODTRAN (MODerate resolution atmosphere TRANsmission) theory to conduct atmospheric correction. It starts from a standard equation for spectral radiance at a sensor pixel, L that applies to the solar wavelength range and flat, Lambertian materials or their equivalents. The equation is as follows: Ap -PeS ) )+( Bpe FLAASH = (1 1 -PeS +La Where: pis the pixel surface reflectance , Pe is an average surface reflectance for the pixel and a surrounding region S is the spherical albedo of the atmosphere La is the radiance back scattered by the atmosphere A and B are coefficients that depend on atmospheric and geometric conditions but not on the surface. Each of these variables depends on the spectral channel the wavelength index has been omitted for simplicity. The first term in this equation corresponds to radiance that is reflected from the surface and travels directly into the sensor, while the second term corresponds to radiance from the surface that is scattered by the atmosphere into the sensor. The distinction between p and Pe accounts for the adjacency effect (spatial mixing of radiance among nearby pixels) caused by atmospheric scattering. To ignore the adjacency effect correction, set pe = significant reflectance errors at short wavelengths, especially under hazy conditions and when strong contrasts occur among the materials in the scene. p. However, this correction can result in The values of {A,B, Sand La} are determined from calculations of MODTRAN (MODerate resolution atmospheric TRANsmission) , an atmospheric radiative transfer model developed by the Air Force Research Laboratory, USA. MODTRAN calculations use the viewing and solar angles and the mean surface elevation of the measurement, and they assume a certain model atmosphere, aerosol type, and visible range. The values of {A,B, Sand La} are strongly dependent on the water vapor column amount, which is generally not well known and may vary across the scene. To account for unknown and variable column water vapor, the MODTRAN4 calculations are looped over a series of different column amounts, then selected wavelength channels of the image are analyzed to retrieve an estimated amount for each pixel. 29


")
")
")
")
")
")
")
")
")