How Bread Affects Purchases: Economic and Weather Analysis
Explore how changes in currency value and weather impact bakery purchases, examining correlations between factors like temperature, moon phase, and GBP/USD rates. Discover insights on the relationship between economic conditions, weather patterns, and consumer behavior in bakery purchases.
Download Presentation

Please find below an Image/Link to download the presentation.
The content on the website is provided AS IS for your information and personal use only. It may not be sold, licensed, or shared on other websites without obtaining consent from the author. If you encounter any issues during the download, it is possible that the publisher has removed the file from their server.
You are allowed to download the files provided on this website for personal or commercial use, subject to the condition that they are used lawfully. All files are the property of their respective owners.
The content on the website is provided AS IS for your information and personal use only. It may not be sold, licensed, or shared on other websites without obtaining consent from the author.
E N D
Presentation Transcript
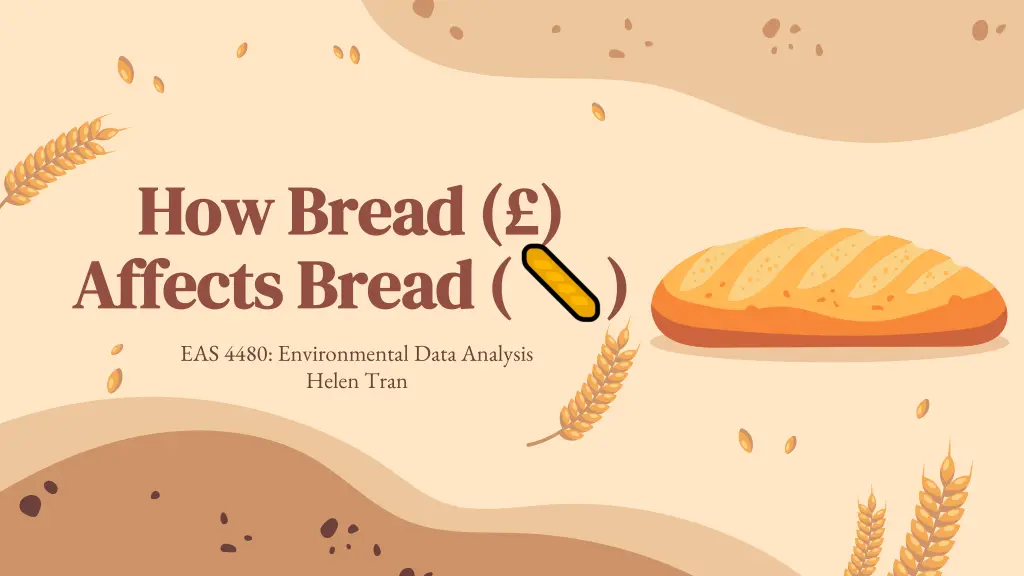
How Bread () How Bread ( ) Affects Bread ( Affects Bread ( EAS 4480: Environmental Data Analysis Helen Tran ) )
Objectives Objectives Economy & Purchases Economy & Purchases Weather & Purchases Weather & Purchases Do changes in the value of a currency (pound sterling ) affect the amount and kind of purchases at a bakery? Does weather affect the amount and kind of purchases at a bakery? Motivations Motivations The lipstick effect: during economic crisis women substitute higher cost luxury goods for lower cost ones like lipstick. (MacDonald & Dildar, 2020) Studies have shown that weather significantly impacts the retail sales and foot traffic. (Stulec, 2013) Would baked goods be considered a lower cost luxury or follow standard economic theory where all consumption decreases? Does this also apply to food retailers and if so can it change the kind of purchases made?
Data Sources Data Sources Bakery Purchases Bakery Purchases Economic Economic Weather Weather The Bread Basket -Kaggle Edinburgh, Scotland Over 20,000 transcations Jan 11, 2016 Dec 3, 2017 Great British Pound (GBP) to United States Dollar (USD) Investing.com Jan 11, 2016 Dec 1, 2017 Edinburgh, Scotland Visual Crossing Daily weather data Temperature Humidity Precipitation Moonphase& more Data is bimonthly for most of the time with more frequent data only available from Nov 2016 to March 2017 Does not include weekends or holidays for data Abundant data, even has the option for hourly data
Statistical Techniques Statistical Techniques Correlation Correlation 01 01 Variables: feels like temperature, moonphase, GBP/USD Bootstrap Bootstrap 02 02 Will be used to measure accuracy of significant correlations 0 0
Total Purchases Total Purchases Correlation Feels like temperature & daily purchases: Moon phase & daily purchases: GBP/USD & daily purchases: These are no significant correlations between the total amount of daily purchases and the variables. r = -0.0062 & p = 0.9507 r = -0.1611 & p = 0.1040 r = 0.1589 & p = 0.1090 not significant not significant not significant
Beverages: Coffee & Tea Beverages: Coffee & Tea Correlation Feels like temperature & beverage purchases: Moon phase & beverage purchases: GBP/USD & beverage purchases: These are no significant correlations between the amount of daily beverage purchases and the variables. r = -0.0279 & p = 0.7793 r = -0.1021 & p = 0.3047 r = 0.1146 & p = 0.2490 not significant not significant not significant
Desserts: Cake & Cookies Desserts: Cake & Cookies Correlation Feels like temperature & dessert purchases: Moon phase & dessert purchases: GBP/USD & dessert purchases: These are no significant correlations between the amount of dessert purchases and the variables. r = -0.1261 & p = 0.2042 r = 0.0481 & p = 0. 6295 r = -0.1374 & p = 0.1663 not significant not significant not significant
Bread Bread Correlation & Bootstrap Feels like temperature & bread purchases: Moon phase & bread purchases: GBP/USD & bread purchases: There is only a significant correlation between bread purchases and the moon phase and had a small negative value of -0.1983. Bootstrap sampling of the moon phase correlation coefficient had a mean of -0.1975 meaning the original correlation coefficient was accurate. r = -0.0255 & p = 0.7979 r = -0.1983 & p = 0. 0447 r = 0.0554 & p = 0.5787 not significant significant not significant Institution name here Institution name here 20xx 20xx- -20xx 20xx
Pastries Pastries Correlation & Bootstrap Feels like temperature & pastry purchases: Moon phase & pastry purchases: GBP/USD & pastry purchases: Moon phase and GBP/USD both had small significant correlations with daily pastry purchases. Bootstrap sampling of the moon phase correlation coefficient had a mean of -0.2719 meaning the original correlation coefficient was accurate. For the GBP/USD it was 0.3071. r = -0.0797 & p = 0.4238 r = -0.2716 & p = 0. 0055 r = 0.3251 & p = 0.0008 not significant significant significant Institution name here Institution name here 20xx 20xx- -20xx 20xx
Conclusion Conclusion Pastries positive correlation with GBP could mean that it is seen as a treat that follows standard economic theory where its consumption decreases during difficult economic times. Both bread and pastries had a negative correlation coefficient with moonphase meaning that with fuller moons people ate less. This aligns with previous research where peoples meals became smaller with full moons (De Castro & Pearcey, 1995).
References References De Castro, John M & Pearcey, Sharon M. (1995). Lunar rhythms of the meal and alcohol intake of humans. Physiology & Behavior. 57(3). 10.1016/0031-9384(94)00232-T. MacDonald, Daniel & Dildar, Yasemin. (2020). Social and psychological determinants of consumption: Evidence for the lipstick effect during the Great Recession. Journal of Behavioral and Experimental Economics. 86. 101527. 10.1016/j.socec.2020.101527. Rose, Natalie & Dolega, Les. (2022). It s the Weather: Quantifying the Impact of Weather on Retail Sales. Applied Spatial Analysis and Policy. 15. 10.1007/s12061-021-09397-0. Data Sources Bakery Sales Dataset (kaggle.com) GBP USD Historical Data - Investing.com Historical weather data for Edinburgh,United Kingdom | Visual Crossing
Thanks! Thanks! Do you have any questions? CREDITS: This presentation template was created by Slidesgo Slidesgo, including icons by Flaticon and infographics & images by Freepik Flaticon Freepik

