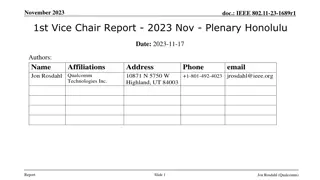
IEEE 802.11-17/0551r1 AANI SC Meeting Agenda April 2017
The agenda for the IEEE 802.11-17/0551r1 AANI SC meeting held in April 2017 includes topics such as administrative reminders, liaison statements, future planning sessions, guidelines for IEEE-SA meetings, and more. The meeting was chaired by Joseph Levy from InterDigital along with Vice Chair Roger Marks from EthAirNet Associates. Attendees were reminded to follow operating rules and guidelines for a productive discussion.

Download Presentation

Please find below an Image/Link to download the presentation.
The content on the website is provided AS IS for your information and personal use only. It may not be sold, licensed, or shared on other websites without obtaining consent from the author.If you encounter any issues during the download, it is possible that the publisher has removed the file from their server.
You are allowed to download the files provided on this website for personal or commercial use, subject to the condition that they are used lawfully. All files are the property of their respective owners.
The content on the website is provided AS IS for your information and personal use only. It may not be sold, licensed, or shared on other websites without obtaining consent from the author.
E N D
Presentation Transcript
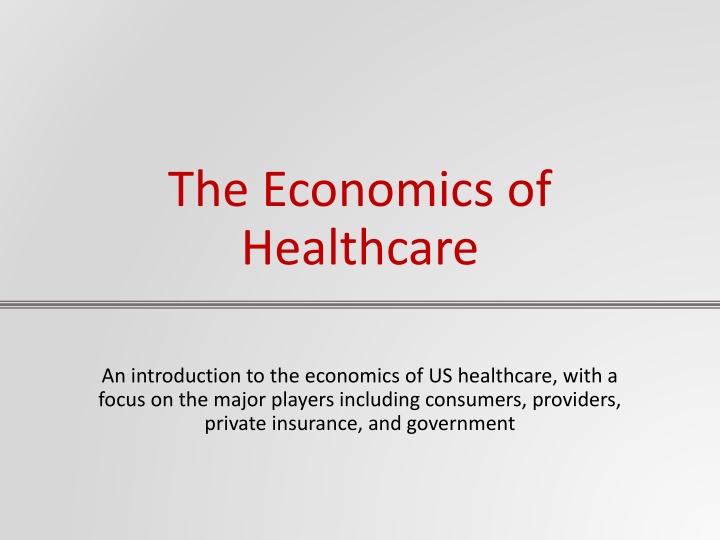
The Economics of Healthcare An introduction to the economics of US healthcare, with a focus on the major players including consumers, providers, private insurance, and government
Acknowledgments This PowerPoint presentation is based on and includes content derived from the following resources: Creative Commons resource which may be downloaded for free at: A Healthy Economy , chapter 16 from the book Theory and Applications of Economics (v. 1.0). https://2012books.lardbucket.org/books/theory-and-applications-of- economics/s20-a-healthy-economy.html Kaiser Family Foundation Centers for Disease Control and Prevention Peterson-Kaiser Health System Tracker 2
Key Questions What are the main challenges facing healthcare and the healthcare industry in the U.S.? What are the current trends in U.S. healthcare expenditures and why? How and why do private consumers obtain health insurance and what are its basic features? What important role does information play in health insurance and health service delivery? How do changes in the demand for and supply of medical services affect healthcare spending and costs? What are the justifications for government intervention in the health insurance markets What are Medicare and Medicaid and how and for whom do they provide medical services? How do healthcare spending and health outcomes differ across countries? 3
An Overview of the U.S. Healthcare System How healthy is the population over time? Is quality of healthcare improving? How are healthcare costs changing? Are healthcare services accessible to all? Video: Health of the U.S. Healthcare System https://www.healthsystemtracker.org/health-of-the-healthcare- system/ Source: Kaiser Family Foundation 4
Challenges for U.S. Healthcare Increasing healthcare costs per capita. Access to healthcare for the uninsured and populations in rural/remote communities. Increasing healthcare spending as a percentage of GDP. Commitment of private insurers to pay for certain care including preexisting conditions. Commitment of medical providers to provide services given increasing costs. 5
Trends in National Health Expenditures Expenditures per Capita ($) Expenditures as Percent of GDP Year 1960 $ 146 5 1970 355 6.9 1980 1,108 8.9 1990 2,843 12.1 2000 4,856 13.3 2009 8,143 17.3 2015 9,994 17.7 2016 10,346 17.9 Source: Centers for Disease Control and Prevention https://www.cdc.gov/nchs/data/hus/2017/093.pdf 6
Personal Healthcare Expenditures and Types of Expenditures 2000 2009 2015 2016 100.0 100.0 100.0 100.0 All sources of funds 17.1 13.9 12.5 12.4 Out-of-pocket payments 72.6 77.4 79.2 79.2 Health insurance 34.9 34.7 34.7 35.1 Private health insurance 18.6 22.2 22.4 22.1 Medicare 16.1 16.4 17.9 17.8 Medicaid 9.4 10.9 11.3 11.3 Federal 6.7 5.5 6.6 6.6 State and local 0.2 0.5 0.4 0.5 CHIP2/ 0.2 0.3 0.3 0.4 Federal 0.1 0.1 0.1 0.0 State and local 2.8 3.6 3.8 3.7 Other health insurance programs3/ 10.2 8.7 8.3 8.4 Other third-party payers and programs4/ Source: Centers for Disease Control and Prevention 7
Health Insurance Rational: Risk Sharing and Risk Aversion. Nearly 60 percent of Americans obtain health insurance through their employer. Employer contributions to employee health insurance are not taxable to workers Lower average risk to underwrite a pool of employees than individually A deductible: the amount of loss in dollars that the insured must pay before the insurer makes any payment. A copayment: the proportion of the loss (after the deductible) that is the responsibility of the insured. 8
Informational Problems in Health Insurance Adverse Selection: a situation in which those who buy health insurance are the ones most likely to need it. Insurance companies may look to historical health information and employment status as signals of health risk. Moral Hazard: a situation in which the insured may engage in more risky behavior after purchasing health insurance. Insurance contracts contain incentives such as deductibles or copayments to minimize the insured s risky behavior. 9
Traditional Approach: Changes in the Price of Healthcare Services Left graph: Healthcare costs can increase due to an increase in the demand for healthcare services Right graph: Healthcare costs can increase due to a decrease in the supply of healthcare services. 10
Demand for Healthcare Services Determinants of the demand for healthcare services Insurance agreements Lack of information Demand inelasticity Healthcare as an investment Heterogeneous services 11
Supply of Healthcare Services Determinants of the supply of healthcare services Market power of providers Government providers Private not-for-profit providers Heterogeneous services Professional barriers to entry: licensing Technology 12
Medicaid A joint federal and state program that provides healthcare to low-income households. Per approval by the federal government, Medicaid is designed and run by each state and may vary by state. For additional facts about Medicaid, refer to the following links: http://www.cms.gov/MedicaidGenInfo Link: https://www.kff.org/medicaid/issue-brief/10-things-to-know- about-medicaid-setting-the-facts-straight/ Source: Kaiser Family Foundation 13
Why Does Government Intervene in Healthcare? Externalities: Benefits to others when services are provided to U.S. citizens. The uninsured Medicare and Medicaid. Quality of care. Commitment Private insurers; Health services providers. Availability of information care, drugs, pricing. 14
Medicare: Facts and Figures Medicare is a federal program that provides healthcare and services to the elderly and disabled. The federal government sets fees for services by healthcare providers. Refer to the following for key facts and information on Medicare spending: http://www.medicare.gov/default.aspx https://www.kff.org/medicare/issue-brief/the-facts-on-medicare- spending-and-financing/ Source: Kaiser Family Foundation 15
The Factors that Determine What Consumers Pay and What Providers Receive Private Insurance Medicaid Medicare Access to/availability of healthcare services 16
Healthcare Spending and Outcomes Across Countries Growing gap in health expenditures as percent of GDP between the US and other advanced economies. Per capita health expenditures higher in the US than in comparable advanced economies. Decreasing growth rate in per capita health expenditures in the U.S. and other advanced economies. The outcomes on access and quality relative to other advanced economies are mixed despite higher per capita U.S. health spending. Source: https://www.healthsystemtracker.org/chart-collection/health- spending-u-s-compare-countries/#item-start 17
Health Consumption Expenditures Per Capita (purchasing power parity PPP adjusted) Expenditures per Capita ($) Country Australia $ 4,543 Belgium 4,774 Canada 4,826 Germany 5,728 Switzerland 8,009 United Kingdom 4,246 United States 10,224 Source: Peterson-Kaiser Health System Tracker https://www.healthsystemtracker.org/chart-collection/health-spending-u-s-compare- countries/#item-start 18