Integrating Kinetic Energy for Tropical Cyclone Analysis
In this study by Emily Madison, the use of Integrated Kinetic Energy as a comprehensive index to evaluate the destructiveness of tropical cyclones is explored. The research delves into methods, data analysis, and correlations with the Saffir-Simpson Scale, aiming to enhance our understanding of cyclone impacts and improve disaster preparedness.

Download Presentation

Please find below an Image/Link to download the presentation.
The content on the website is provided AS IS for your information and personal use only. It may not be sold, licensed, or shared on other websites without obtaining consent from the author.If you encounter any issues during the download, it is possible that the publisher has removed the file from their server.
You are allowed to download the files provided on this website for personal or commercial use, subject to the condition that they are used lawfully. All files are the property of their respective owners.
The content on the website is provided AS IS for your information and personal use only. It may not be sold, licensed, or shared on other websites without obtaining consent from the author.
E N D
Presentation Transcript
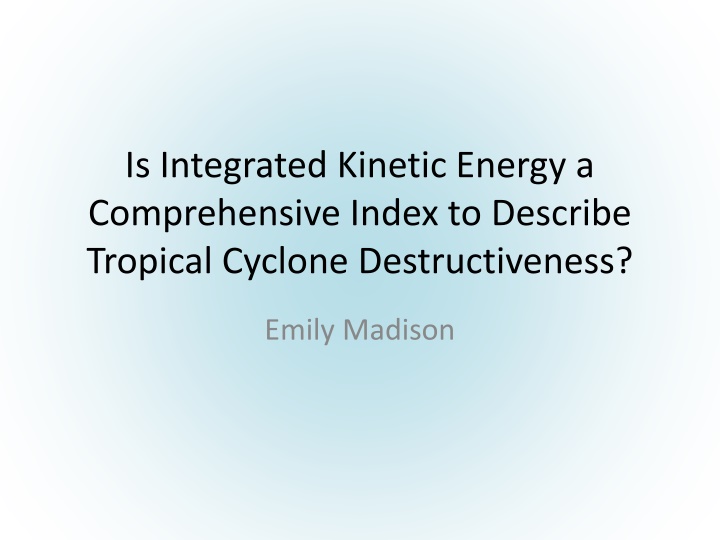
Is Integrated Kinetic Energy a Comprehensive Index to Describe Tropical Cyclone Destructiveness? Emily Madison
Overview Introduction Methods and Data Results Discussion Conclusions
Introduction 2004 and 2005 Atl hurricane season spurred thoughts of retiring Saffir-Simpson Hurricane Scale Hurricane Katrina and Sandy costliest, but were Categories 3 and 1 at landfall Size of storm a major factor of destruction Use Index/Scale that includes both max velocity and storm size
Data Extended Best Track Dataset Climatology of Atlantic tropical cyclones (TC) Data used (at/near landfall): 1-miunte maximum sustained surfaces winds Radius of maximum wind Radius of hurricane wind Time steps 6-hourly Translational speed calculated from time and lat/lon Costliness data from NHC review of the deadliest, costliest, and most intense U.S. TC from 1851 to 2012 Cost in billions $US
Methods Linearly interpolated time and other data to hourly time steps Calculated Hurricane Intensity Index, Hurricane Hazard Index, and Weight Integrated Kinetic Energy
Saffir Simpson Scale Type Vmaxm/s 33-42 Category 1 Category 2 43-49 Category 3 50-58 Category 4 59-69 Category 5 >70 Where: Vmax = 1-miunte maximum sustained surfaces winds R = maximum radius S = translational velocity Vmax0 = 74 mph R0 = 60 miles S0 = 15 mph HII = (Vmax/Vmax0)2 HHI = (R/R0)2(Vmax/Vmax0)3(S/S0)
Methods Correlation coefficient calculated between Cost and each scale/index Regression analyses Least squares Reduced Major Axis (RMA) Principal Component Determined variance explained by each fit Residuals analyzed Bootstrapped least squares slope and correlation coefficient
Results of Regressions SSS HII HHI IKE r(corrcoef) 0.0634 0.2779 0.5622 0.7345 R2 (variance explained) SSS HII HHI IKE LS 0.004 0.0772 0.316 0.5395 RMA 1 1 1 1 PC 0.97 0.98 0.72 0.87 IKE with highest correlation coefficient RMA fit R2 =1
Residuals Tested for normal distribution of residuals using chi-squared test RMA only regression that failed to reject the null hypothesis (distribution is normal)
Bootstrap Results SSS HII HHI IKE Ls slope 2.2692 16.3461 0.2845 0.1683 r 0.0634 0.2779 0.5622 0.7345 Mean r boot 0.1030 0.2497 0.5544 0.6984 Mean slope boot 2.6071 16 0.3 1.771 R CI 0.0836- 0.1225 0.2274- 0.27194 0.5391- 0.5695 0.6832- 0.7134 Slope CI 1.9244- 3.2897 14.5746- 17.4889 0.2921- 0.3115 0.1711- 0.1830 Chi-squared boot reject reject reject reject
Discussion Continuous scales provide better correlation coefficients IKE has the largest correlation coefficient RMA best fit R2 = 1 Residuals follow normal distribution (However, PC fit takes into account variance in x-values; also, had decent variances ) Can put some stock in correlation coefficients as bootstrap resampled average corrcoeffs very close Not so much for confidence intervals as distributions not necessarily normal
Conclusion Results show the addition of size in hurricane intensity indices better explains costliness of storm IKE explains more variance than HHI Important to note that coastal vulnerability, infrastructure and affected population should also be taken into account IKE useful for forecasting destruction potential for response planning purposes