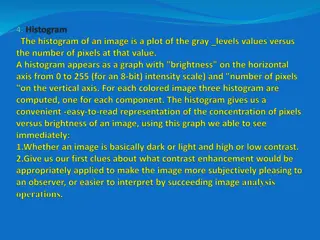
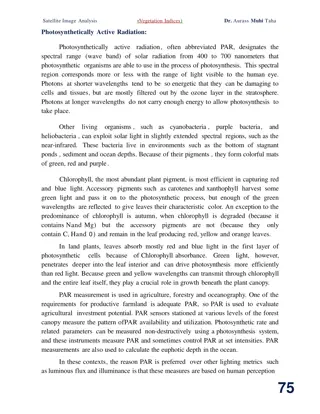
Learn about the art of image interpretation for remote sensing imagery analysis. Understand the unique challenges and skills required to interpret images from unfamiliar perspectives, outside the visible spectrum, and at varying scales and resolutions. Gain insights into classification, detection, recognition, identification, and enumeration tasks involved in analyzing satellite images.
Please find below an Image/Link to download the presentation.
The content on the website is provided AS IS for your information and personal use only. It may not be sold, licensed, or shared on other websites without obtaining consent from the author. If you encounter any issues during the download, it is possible that the publisher has removed the file from their server.
You are allowed to download the files provided on this website for personal or commercial use, subject to the condition that they are used lawfully. All files are the property of their respective owners.
The content on the website is provided AS IS for your information and personal use only. It may not be sold, licensed, or shared on other websites without obtaining consent from the author.
E N D
Presentation Transcript
(Satellite Image Interpretation) Satellite Image Analysis Dr. Aurass Muhi Taha Satellite Image Interpretation: Human beings are well prepared to examine images, as our visual system and experience equip us to discern subtle distinctions in brightness and darkness, to distinguish between various image textures, to perceive depth, and to recognize complex shapes and features. Even in early childhood we apply such skills routinely in everyday experience so that few of us encounter difficulties as we examine, for example, family snapshots or photographs in newspapers. Yet image analysis requires a conscious, explicit effort not only to learn about the subject matter, geographic setting, and imaging systems (as mentioned above) in unfamiliar contexts but also to develop our innate abilities for image analysis. Three issues distinguish interpretation of remotely sensed imagery from interpretation conducted in everyday experience: 1)Remotely sensed images usually portray an overhead vtew an unfamiliar perspective. Training, study, and experience are required to develop the ability to recognize objects and features from this perspective. 2)Many remote sensing images use radiation outside the visible portion of the spectrum in fact, use of such radiation is an important advantage that we exploit as often as possible. Even the most familiar features may appear quite different in nonvisible portions of the spectrum than they do in the familiar world of visible radiation. 3)Remote sensing images often portray the Earth's surface at unfamiliar scales and resolutions. Commonplace objects and features may assume strange shapes and appearances as scale and resolution change from those to which we are accustomed. This chapter outlines the art of image interpretation as applied to aerial photography. Students cannot expect to become proficient in image analysis simply by reading about image interpretation. Experience forms the only sure preparation for skillful interpretation. Nonetheless, this chapter can highlight some ofthe issues that form the foundations for proficiency in image analysis. In order to discuss this subject at an early point in the text, we must confine the discussion to interpretation of aerial photography, the only form of remote sensing imagery discussed thus far. But the principles, procedures, and equipment described here are equally applicable to other kinds of imagery acquired by the sensors. 30
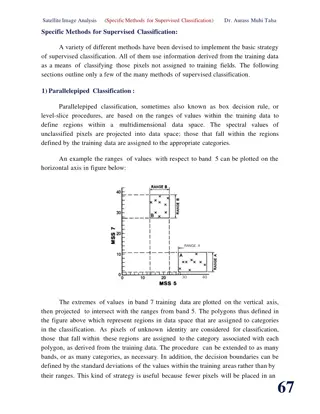
(Satellite Image Interpretation) SatelliteImage Analysis Dr. Aurass Muhi Taha Image Interpretation Tasks: The image interpreter must routinely conduct several kinds of tasks, many of which may be completed together in an integrated process. Nonetheless, for purposes of clarification, it is important to distinguish between these separate functions: 1) Classification: Classification is the assignment of objects, features, or areas to classes based on their appearance on the imagery. Often a distinction is made between three levels of confidence and precision. Detection is the determination of the presence or absence of a feature. Recognition implies a higher level of knowledge about a feature or object, such that the object can be assigned an identity in a general class or category. Finally, identification means that the identity of an object or feature can be specified with enough confidence and detail to place it in a very specific class. Often an interpreter may qualify his or her confidence in an interpretation by specifying the identification as "possible" or "probable." 2) Enumeration : Enumeration is the task of listing or counting discrete items visible on an image. For example, housing units can be classified as "detached single-family home," "multifamily complex," "mobile home," and "multistory residential," and then reported as numbers present within a defined area. Clearly, the ability to conduct such an enumeration depends on an ability to accurately identify and classify items as discussed above. 31
(Satellite Image Interpretation) SatelliteImage Analysis Dr. Aurass Muhi Taha 3) Measurement: Measurement, image interpretation problems. Two kinds of measurement are important. First is the measurement of distance and height and, by extension, of volumes and areas as well. The practice of making such photogrammetry, which applies knowledge of image geometry to the derivation of accurate distances. Although, strictly speaking, photogrammetry measurements from photographs, by extension it has analogs for the derivation of measurements from other kinds of remotely sensed images. or mensuration, an important function in many IS measurements forms the subject of applies only to A second form of measurement is quantitative assessment of image brightness. The science of photometry is devoted to measurement of the intensity of light and includes estimation of scene brightness by examination of image tone, using special instruments known as densitometers. If the measured radiation extends outside the visible spectrum, the term radiometry applies. Both photometry and radiometry apply similar instruments and principles, so they are closely related. 4) Delineation: Finally, the interpreter must often delineate, or outline, regions as they are observed on remotely sensed images. The interpreter must be able to separate distinct areal units that are characterized by specific tones and textures and to identify edges or boundaries between separate areas. Typical examples include delineation of separate classes of forest or of land use both of which occur only as areal entities (rather than as discrete objects).Typical problems include: a)Selection of appropriate levels of generalization (e.g., when boundaries are intricate, or when many tiny but distinct parcels are present); b)Placement of boundaries when there IS a gradation (rather than a sharp edge) between two units. 32
(Satellite Image Interpretation) SatelliteImage Analysis Dr. Aurass Muhi Taha The image analyst may simultaneously apply several of these skills in examining an image. Recognition, delineation, and mensuration may all be required as the interpreter examines an image. Yet specific interpretation problems may emphasize specialized skills. Military photo interpretation often depends on accurate recognition and enumeration of specific items of equipment, whereas land-use inventory emphasizes delineation, although other skills are obviously important. Image analysts therefore need to develop proficiency in all of these skills. Imagery Interpretability Rating Scales: Remote sensing imagery can vary greatly in quality due to both environmental and to technical conditions influencing acquisition of the data. In the United States, some governmental agencies use rating scales to evaluate the suitability of imagery for specific purposes. TheNational Imagery Interpretability Rating Scale (NIIRS) has been developed for single-channel and panchromatic imagery, and the Multispectral Imagery Interpretability Rating Scale has been developed for multispectral imagery. Such scales are based on evaluations using a large number of experienced interpreters to independently evaluate images of varied natural and manmade features, as recorded by images of varying characteristics. They provide a guide for evaluation of whether a specific form of imagery is likely to be satisfactory for specific purposes. Image Interpretation Keys: Image interpretation keys are valuable aids for summanzmg complex information portrayed as images. They have been widely used for image interpretation. Such keys serve either or both of two purposes: 1)A means of training inexperienced personnel in the interpretation of complex or unfamiliar topics, 2)A reference aid for experienced interpreters to organize information and examples pertaining to specific topics. 33
(Satellite Image Interpretation) Satellite Image Analysis Dr. Aurass Muhi Taha An image interpretation key is simply reference material designed to permit rapid and accurate identification of objects or features represented on aerial images. A key usually consists of two parts: 1)A collection of annotated or captioned images or stereograms. 2)A graphic or word description, possibly including sketches or diagrams. These materials are organized in a systematic manner that permits retrieval of desired images by, for example, date, season, region, or subject. Keys of various forms have been used for many years in the biological sciences, especially botany and zoology. These disciplines rely on complex taxonomic systems that are so extensive that even experts cannot master the entire body of knowledge. The key, therefore, is a means of organizing the essential characteristics of a topic in an orderly manner. It must be noted that scientific keys of all forms require a basic familiarity with the subject matter. A key is not a substitute for experience and knowledge but a means of systematically ordering information sothat an informed user can learn it quickly. Keys were first routinely applied to aerial images during World War II, when it was necessary to train large numbers of inexperienced photo interpreters in the identification of equipment of foreign manufacture and in the analysis of regions far removed from the experience of most interpreters. The interpretation key formed an effective way of organizing and presenting the expert knowledge of a few individuals. After the war ended, interpretation keys were applied to many other subjects, including agriculture, forestry, soils, and landforms. Their use has been extended from aerial photography to other forms of remotely sensed imagery. Today interpretation keys are still used for instruction and training, but they may have somewhat wider use as reference aids. Also, it is true that construction of a key tends to sharpen one's interpretation skills and encourages the interpreter to think more clearly about the interpretation process. Keys designed solely for use by experts are referred to as technical keys. Nontechnical keys are those designed for use by those with a lower level of expertise. Often it is more useful to classify keys by their formats and organizations. Essay keys consist of extensive written descriptions, usually with annotated images as illustrations. A file key is essentially a personal image file with notes its completeness reflects the interests and knowledge of the compiler. Its content and organization suit the needs of the compiler, so it may not be organized in a manner suitable for use by others. Interpretive Overlays: Often in resource-oriented interpretations it is necessary to search for complex associations of several related factors that together define the distribution or pattern of interest. For example, often soil patterns may be revealed by distinctive relationships between separate patterns of vegetation, slope, and drainage. The interpretive overlays approach to image interpretation is a way of deriving information from complex3 4
Satellite Image Analysis (Satellite Image Interpretation ) Dr. Aurass Muhi Taha interrelationships between separate distributions recorded on remotely sensed images. The correspondence between several separate patterns may reveal other patterns not directly visible onthe image: DRAINAGE GEOLOGY VEGETATION TOPOGRAPHY LAND USE SLOPE The method is applied by means of a series of individual overlays for each image to be examined. The first overlay might show the major classes of vegetation, perhaps consisting of dense forest, open forest, grassland, and wetlands. A second overlay maps slope classes, including perhaps level, gently sloping, and steep slopes. Another shows the drainage pattern, and still others might show land use and geology. Thus, for each image, the interpreter may have as many as five or six overlays, each depicting a separate pattern. By superimposing these overlays, the interpreter can derive information presented by the coincidence of several patterns. From his or her knowledge of the local terrain, the interpreter may know that certain soil conditions can be expected where the steep slopes and the dense forest are found together and that others are expected where the dense forest matches to the gentle slopes. From the information presented by several patterns, the interpreter can resolve information not conveyed by any single pattern. Radiation - Target Interactions: Radiation that is not absorbed or scattered in the atmosphere can reach and interact with the Earth's surface. There are three (3) forms of interaction that can take place when energy strikes, or is incident (I) upon the surface. These are: absorption (A); transmission (T); and reflection (R). The total incident energy will interact with 35
(Satellite Image Interpretation) SatelliteImage Analysis Dr. Aurass Muhi Taha the surface in one or more of these three ways. The proportions of each will depend on the wavelength of the energy and the material and condition of the feature. Absorption (A) occurs when radiation (energy) is absorbed into the target while transmission (T) occurs when radiation passes through a target. Reflection (R) occurs when radiation "bounces" off the target and is redirected. In remote sensing, we are most interested in measuring the radiation reflected from targets. We refer to two types of reflection, which represent the two extreme ends of the way in which energy is reflected from a target: specular reflection and diffuse reflection. When a surface is smooth we get specular or mirror-like reflection where all (or almost all) of the energy is directed away from the surface in a single direction. Diffuse reflection occurs when the surface is rough and the energy is reflected almost uniformly in all directions. Most earth surface features lie somewhere between perfectly specular or perfectly diffuse reflectors. Whether a particular diffusely, or somewhere in between, depends on the surface roughness of the feature in comparison to the wavelength of the incoming radiation. If the wavelengths are much smaller than the surface variations or the particle sizes that make up the surface, diffuse reflection will dominate. For example, fine-grained sand would appear fairly smooth to long wavelength microwaves but would appear quite rough to the visible wavelengths. target reflects specularly or 36
(Satellite Image Interpretation) Satellite Image Analysis Dr. Aurass Muhi Taha Reflectance Concept: The measure of how much electromagnetic radiation is reflected off a surface is called its reflectance, which is a number between 0 and 1.0. A measure of 1.0 means the 100% of the incident radiation is reflected off the surface, and a measure of 0 means that 0% is reflected. In the case of first-surface reflection, this measure is called the specular reflectance, which will be designated here as rs (A). The Ain parentheses indicates that specular reflectance is a function of a wavelength. The reason that rs (A) is a function of a wavelength is that the complex index of refraction of the reflecting surface material is dependent on a wavelength. The term complex means that there is a real and imaginary part to the index of refraction. Every material has a complex index of refraction, though for some materials at some wavelengths , only the real part of the complex index of refraction may be nonzero. For a sand grain with complex index of refraction: N(A) = n(A) [1 - ik(A)] The specular reflectance is expressed by Fresnel's equation as follows: grainO < r5(A) < 1, Where: r5(A)=specular n(A)=intrinsic spectral index of reflectance of grain, k(A)== intrinsic spectral index of absorption of grain, g(B, ) =generally nonzero function ofthe angle of incidence( ) and angle of absorption (e) with respect to the macroscopic surface. reflectance of one reflectance The final reflectance of a specular ray bouncing off multiple grains of sand is simply the multiplicative product of specular reflectance from all of the encountered air/grain interface. For instance, if the specular reflectance of three grains for a particular wavelength of electromagnetic radiation were 0.9, 0.8 and 0.7, respectively, the final reflectance of a specular ray bouncing off all three grains would be(O.9)(0.8)(0.7) = 0.504. The specular reflectance of the beach surface,r5(A) is the average of. All the individual specular ray reflectance. The average r5(A) for all the grains in the beach from which electromagnetic radiation is reflected is defined as the volume reflectance of the beach,r5(A). The total reflectance of the beach,rT (A) is the averaged sum of the specular and volume reflectance, as follows: 37
(Satellite Image Interpretation) SatelliteImage Analysis Dr. Aurass Muhi Taha The dependence ofrs(.A) and rv(.A) are markedly different, as demonstrated in below: c01 <-< 0 (:\ I I I I I I I A-L... j _;; )( Ql "'D .E /) l A 1 (t jy t .- + J )...:_ I I -v - I < I I I I ,_ I II ;::<- a: For the case of a uniform grain size and varying wavelength. Three important observations can be summarized from the above discussion: 1)The spectral locations of absorption bands depend on chemical composition of the material; for example, quartz and calcite absorption bands in the thermal infrared wavelength region have different spectral locations because Si and 0 ions in quartz are connected by a "spring" with a different bond strength than that of the" spring" connecting Ca and 0 ions in calcite. 2)The brightness, or magnitude, of the spectral reflectance depends primarily on the size of the reflecting grains. 3)Absorption bands appear as reflectance minima in transparent materials (such as quartz and calcite in the visible wavelength region), whereas absorption bands appear as reflectance maxima in opaque materials. 38


")
")
")
")
")

")
")
")