Interpreting Line Graphs - Vocabulary, Recap, and Activities
Explore the world of line graphs with key vocabulary, quick recap, interactive activities, and a fun exercise of taking Mr. Pearson's dog for a walk. Enhance your understanding and skills in interpreting line graphs today!

Download Presentation

Please find below an Image/Link to download the presentation.
The content on the website is provided AS IS for your information and personal use only. It may not be sold, licensed, or shared on other websites without obtaining consent from the author. If you encounter any issues during the download, it is possible that the publisher has removed the file from their server.
You are allowed to download the files provided on this website for personal or commercial use, subject to the condition that they are used lawfully. All files are the property of their respective owners.
The content on the website is provided AS IS for your information and personal use only. It may not be sold, licensed, or shared on other websites without obtaining consent from the author.
E N D
Presentation Transcript
Line Graphs If any of the links don t work: 1) Right click on the image and go to open hyperlink 2) Copy the address and paste it into the address bar on the internet 3) Google it! We ve included the image so you will be able to find it more easily.
Presenting and Measuring Data Important vocabulary to learn for the week! Click to check you know the definition. Data Information that has been collected by counting or measuring. Scale Points on the axis with equal intervals. Axis A graph has two perpendicular lines (lines at right angles). The horizontal axis is called the x-axis. The vertical axis is called the y-axis. Graph A diagram showing data. Frequency The number of times an event occurs. Line graph A graph where straight lines join points together to show the data. Average Loosely means an ordinary or typical value. There are 3 types of average that we learn about: mean, median and mode. When just the word average is used, it refers to the mean. Mean The sum of a set of numbers, or quantities, divided by the number of terms in the set. Example: The arithmetic mean of 5, 6, 14, 15 and 45 is (5 + 6 + 14 + 15 + 45) 5 i.e. 17.
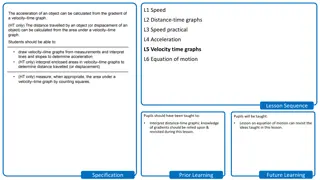
Interpreting Line Graphs Quick recap - say what you know about this line graph
DO IT! Click on the line graph below to learn more about interpreting line graphs. Line Graphs CTC Math - https://www.youtube.com/watch?v=N5eaVBwmTq4
Now complete and mark one of the Interpreting line graphs sheets in the Lesson 1 folder.
EXPLORE IT! Take Your Dog for a Walk Each day Mr Pearson takes his dog for a walk. You can see him on the hyperlinked picture on the right. After you have followed the link, Try moving Mr Pearson and his dog using your computer mouse. The graph shows how far Mr Pearson is walking from his house after a certain amount of time. What happens to the graph once Mr Pearson gets back to his house after his walk? Can you make a curved line on the graph? Describe how Mr Pearson must walk to create this curve. How must Mr Pearson walk to make the curve steeper? Nrich Maths, Take your dog for a walk https://nrich.maths.org /4803 And can you make the curve shallower? How does Mr Pearson walk this time?
EXPLORE IT MORE! Take Your Dog for a Walk Can you make Mr Pearson walk in ways that will create these graphs?