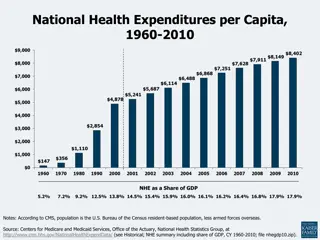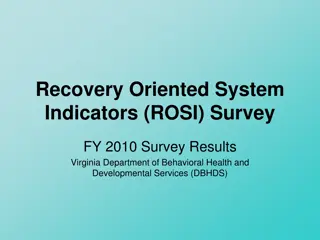
Recovery Oriented Systems Indicator (ROSI) Survey Trends 2010-2015
Discover trends in Recovery Oriented Systems Indicator (ROSI) scores from 2010 to 2015, showcasing improvements in various domains such as social relationships, meaningful activities, formal services, and more. The analysis includes statistical tables, graphs, and insights into respondents' perceptions of recovery orientation in different areas of service provision.

Download Presentation

Please find below an Image/Link to download the presentation.
The content on the website is provided AS IS for your information and personal use only. It may not be sold, licensed, or shared on other websites without obtaining consent from the author. If you encounter any issues during the download, it is possible that the publisher has removed the file from their server.
You are allowed to download the files provided on this website for personal or commercial use, subject to the condition that they are used lawfully. All files are the property of their respective owners.
The content on the website is provided AS IS for your information and personal use only. It may not be sold, licensed, or shared on other websites without obtaining consent from the author.
E N D
Presentation Transcript
Recovery Oriented Systems Indicator (ROSI) Survey Trends in ROSI Scores from 2010 to 2015
TRENDS IN ROSI DOMAIN SCORES The ROSI Survey is made up of 42 items that measure respondents perceptions of their CSB Service Providers orientation towards recovery in eight domains. Changes in Virginia s statewide and regional average survey domain scores over five annual surveys from 2010 to 2015 are shown in the following statistical tables and in graphs as trend lines. F and p values are shown with the following tables. F is a measure of the difference in average survey scores among groups (the higher the number, the bigger the difference). p is a measure of significance (in this case, if p is below .05, the F value is significant). An R2 value is shown at the end of each trend line.This is a measure of how consistent the trend is over time. The closer R2is to 1.00, the better the trend line describes the change in scores.
Statewide, ROSI Survey respondents are finding their CSB staff becoming more recovery oriented, and they are feeling a greater degree of choice Formal Service Staff An independent one-way analysis of variance (ANOVA) revealed a significant difference between mean (average) Staff Domain scores by year: Choice An independent one-way analysis of variance (ANOVA) revealed a significant difference between mean (average) Choice Domain scores by year: Survey Year Number of Respondents Mean Score Survey Year Number of Respondents Mean Score SD SD 2010 3,245 3.33 0.527 2010 3,231 3.18 0.657 2011 3,281 3.37 0.517 2011 3,299 3.24 0.638 2012 3,371 3.40 0.512 2012 3,351 3.27 0.636 2013 3,297 3.41 0.514 2013 3,320 3.27 0.628 2015 3,735 3.39 0.516 2015 3,759 3.26 0.629 F(df-4, n=17,353) = 12.37, p <.001 F(df-4, n=16,955) = 9.90, p <.001
Significant improvements are also found in these four Domains : Social Relationships Meaningful Activities Formal Services Self/Holism F(df-4, n=17,981) = 6.13, p <.001 F(df-4, n=15,010) = 5.44, p <.001 F(df-4, n=16,924) = 4.53, p =.001 F(df-4, n=17,437) = 4.12, p =.002 But there has been no significant statewide change in these two Domains Peer Support Basic Material Resources F(df-4, n=14,774) = 1.19, p =.324 F(df-4, n=16,836) = 1.80, p =.124
ROSI Domains and Trends ROSI Domains Defined Graph Trend Lines Key Meaningful Activities work, education, and other activities that are meaningful help facilitate recovery. Basic Material Resources Recovery is incumbent on basic material resource needs being met. Peer Support peer support in a myriad of forms facilitates recovery Choice Having choices regarding housing, work, social, services, and other areas of life facilitate recovery Social Relationships Social and personal relationships play a role in facilitating recovery Formal Service Staff Formal service staff help or hinder the recovery process Formal Services Formal service systems characteristics can help or hinder the recovery process Self/Holism Characteristics that relate to one s sense of self can help or hinder the recovery process
Trend in ROSI Domain Scores by Year - Statewide 3.5 StatewideTrends Scores have improved MOST for: Formal Service Staff Social Relationships Choice Meaningful Activities R = 0.68 3.4 R = 0.40 R = 0.64 3.3 R = 0.61 Meaningful Activities Formal Services Average ROSI Domain Score Basic Material Resources And 3.2 Peer Support Choice LEAST for: Peer Support Material Resources Social Relationships 3.1 Formal Service Staff R = 0.60 R = 0.03 Formal Services Self/Holism R = 0.10 Meaningful Activities 3.0 Basic Material Resources R = 0.38 Peer Support Choice 2.9 Social Relationships Formal Service Staff Formal Services 2.8 Self/Holism 2010 2011 2012 2013 2015
ROSI Scores Differ between Rural and Urban CSBs P <.001 Five Year Average ROSI Domain Scores Rural vs Urban 3.50 3.40 3.30 3.20 3.10 Axis Title 3.00 2.90 2.80 2.70 2.60 Social Basic Material Resources N= Rural 8,393 Urban 8,448 Meaningful Activities N= Rural 7,157 Urban 7,858 Formal Svc. Staff N= Rural 8,690 Urban 8,668 Formal Services N= Rural 8,528 Urban 8,401 Choice N= Rural 8,507 Urban 8,453 Peer Support N= Rural 7,147 Urban 7,602 Self/Holism N= Rural 8,648 Urban 8,758 Relationships N= Rural 8,889 Urban 9,097 Rural 3.43 3.41 3.36 3.32 3.13 3.11 3.07 2.97 Urban 3.34 3.30 3.31 3.18 2.98 2.96 2.97 2.93
Rural vs. Urban Scores Differed Most in 2012 and Least in 2013 P <.001 Difference in Average Domain Scores by Year: Rural over Urban 1.00 0.90 0.80 2010 - 2015 0.70 2015 0.60 0.50 2013 0.40 2012 0.30 0.20 2011 0.10 2010 0.00 Meaningful Activities Basic Material Resources Formal Service Staff Social Choice Peer Support Formal Services Self/Holism Relationships Total 0.15 0.14 0.14 0.11 0.10 0.09 0.05 0.04 2015 0.18 0.18 0.12 0.10 0.12 0.10 0.04 0.03 2013 0.09 0.09 0.10 0.07 0.07 0.06 0.00 0.01 2012 0.24 0.21 0.20 0.18 0.17 0.13 0.10 0.08 2011 0.09 0.11 0.15 0.11 0.10 0.09 0.06 0.06 2010 0.15 0.12 0.12 0.07 0.06 0.07 0.04 0.01
Trend in ROSI Domain Scores by Year - Rural Rural CSBs Trends Scores have improved MOST for: Meaningful Activities 3.9 3.7 3.5 Meaningful Activities Formal Service Staff Choice R = 0.54 R = 0.28 Average ROSI Domain Score R = 0.18 Basic Material Resources R = 0.30 Peer Support 3.3 And Choice Social Relationships LEAST for: Peer Support R = 0.65 R = 0.08 Formal Service Staff 3.1 Formal Services R = 0.05 Self/Holism R = 0.16 Meaningful Activities 2.9 Basic Material Resources Peer Support Choice Social Relationships 2.7 Formal Service Staff Formal Services Self/Holism 2.5 2010 2011 2012 2013 2015
Trend in ROSI Domain Scores by Year - Urban Urban CSBs Trends Scores have improved MOST for: Choice Social Relationships Formal Service 3.9 3.7 3.5 Meaningful Activities Staff R = 0.57 Average ROSI Domain Score Basic Material Resources And R = 0.67 R = 0.04 Peer Support LEAST for: Formal Services Peer Support Material Resources 3.3 Choice R = 0.73 Social Relationships Formal Service Staff 3.1 Formal Services R = 0.06 Self/Holism R = 0.17 R = 0.04 R = 0.47 Meaningful Activities 2.9 Basic Material Resources Peer Support Choice Social Relationships 2.7 Formal Service Staff Formal Services Self/Holism 2.5 2010 2011 2012 2013 2015
Five Year Average ROSI Domain Scores Differ by Region 3.70 P <.001 3.50 3.30 3.10 2.90 2.70 2.50 Formal Service Staff Social Basic Material Resources Meaningful Activities Formal Services Choice Peer Support Self/Holism Relationships 3 3.56 3.53 3.45 3.47 3.24 3.24 3.17 3.09 1 3.38 3.35 3.35 3.25 3.16 3.06 3.05 2.95 7 3.38 3.35 3.33 3.24 3.03 2.93 2.99 2.95 Statewide 3.38 3.36 3.34 3.25 3.06 3.03 3.02 2.95 6 3.37 3.36 3.30 3.28 3.05 3.13 3.08 2.89 4 3.37 3.34 3.33 3.21 2.98 2.97 3.03 2.92 2 3.34 3.30 3.32 3.16 2.95 2.92 2.92 2.92 5 3.32 3.31 3.29 3.19 3.01 3.02 2.96 2.90
Trend in ROSI Domain Scores - 2010-2015: Region 3 3.7 Region 3 Trends Scores have improved substantially in Every Domain R = 0.83 R = 0.73 3.6 R = 0.83 3.5 R = 0.70 Except for: Peer Support Average ROSI Domain Score 3.4 Meaningful Activities R = 0.44 R = 0.71 Basic Material Resources 3.3 Peer Support Choice 3.2 Formal Service Staff R = 0.16 R = 0.87 Formal Services Social Relationships 3.1 Self/Holism Linear (Meaningful Activities) Linear (Basic Material Resources) 3.0 Linear (Peer Support) Linear (Choice) 2.9 Linear (Formal Service Staff) Linear (Formal Services) Linear (Social Relationships) 2.8 Linear (Self/Holism) 2010 2011 2012 2013 2015
Trend in ROSI Domain Scores - 2010-2015: Region 1 3.7 Region 1 Trends Scores have improved MOST for: Formal Service Staff Formal Services Meaningful Activities 3.6 3.5 R = 0.56 Average ROSI Domain Score 3.4 R = 0.30 R = 0.21 And Meaningful Activities LEAST for: Material Resources Basic Material Resources 3.3 R = 0.27 Peer Support Choice 3.2 Formal Service Staff R = 0.02 Formal Services Social Relationships R = 0.30 3.1 Self/Holism R = 0.23 Linear (Meaningful Activities) Linear (Basic Material Resources) 3.0 R = 0.15 Linear (Peer Support) Linear (Choice) 2.9 Linear (Formal Service Staff) Linear (Formal Services) Linear (Social Relationships) 2.8 Linear (Self/Holism) 2010 2011 2012 2013 2015
Trend in ROSI Domain Scores - 2010-2015: Region 7 3.7 Region 7 Trends Scores have improved MOST for: Material Resources Choice Formal Service Staff 3.6 3.5 R = 0.35 And Average ROSI Domain Score 3.4 R = 0.20 Meaningful Activities LEAST for: Self/Holism Social Relationships R = 0.02 Basic Material Resources 3.3 R = 0.54 Peer Support Choice Scores DECLINED for Peer Support 3.2 Formal Service Staff Formal Services Social Relationships 3.1 Self/Holism R = 0.66 Linear (Meaningful Activities) Linear (Basic Material Resources) 3.0 R = 0.24 R = 0.05 R = 0.00 Linear (Peer Support) Linear (Choice) 2.9 Linear (Formal Service Staff) Linear (Formal Services) Linear (Social Relationships) 2.8 Linear (Self/Holism) 2010 2011 2012 2013 2015
Trend in ROSI Domain Scores - 2010-2015: Region 6 3.7 Region 6 Trends Scores have improved MOST for: Peer Support 3.6 3.5 And R = 0.23 R = 0.20 LEAST for: Average ROSI Domain Score 3.4 Meaningful Activities Social Relationships Material Resources R = 0.05 R = 0.14 Basic Material Resources 3.3 Peer Support Scores DECLINED for Self/Holism Choice 3.2 Formal Service Staff R = 0.16 Formal Services R = 0.78 Social Relationships 3.1 Self/Holism R = 0.07 Linear (Meaningful Activities) Linear (Basic Material Resources) 3.0 Linear (Peer Support) Linear (Choice) 2.9 Linear (Formal Service Staff) Linear (Formal Services) R = 0.16 Linear (Social Relationships) 2.8 Linear (Self/Holism) 2010 2011 2012 2013 2015
Trend in ROSI Domain Scores - 2010-2015: Region 4 3.7 Region 4 Trends Scores have DECLINED MOST for: Material Resources Social Relationships Choice 3.6 3.5 Average ROSI Domain Score 3.4 Meaningful Activities Self/Holism And R = 0.18 Basic Material Resources 3.3 R = 0.43 R = 0.50 Peer Support LEAST for: Choice Meaningful Activities Peer Support Formal Services Staff 3.2 Formal Service Staff R = 0.47 Formal Services Social Relationships 3.1 Self/Holism Linear (Meaningful Activities) Linear (Basic Material Resources) R = 0.16 3.0 R = 0.00 R = 0.88 Linear (Peer Support) Linear (Choice) 2.9 Linear (Formal Service Staff) R = 0.30 Linear (Formal Services) Linear (Social Relationships) 2.8 Linear (Self/Holism) 2010 2011 2012 2013 2015
Trend in ROSI Domain Scores - 2010-2015: Region 5 3.7 Region 5 Trends Scores have improved MOST for: Self/Holism Social Relationships Choice Formal Services 3.6 3.5 Average ROSI Domain Score 3.4 Meaningful Activities Formal Service Staff And R = 0.46 R = 0.47 R = 0.71 Basic Material Resources 3.3 Peer Support LEAST for: Choice R = 0.51 Formal Service Staff Peer Support Scores DECLINED for Material Resources 3.2 Formal Services Social Relationships 3.1 Self/Holism R = 0.22 Linear (Meaningful Activities) Linear (Basic Material Resources) 3.0 R = 0.44 Linear (Peer Support) R = 0.00 R = 0.80 Linear (Choice) 2.9 Linear (Formal Service Staff) Linear (Formal Services) Linear (Social Relationships) 2.8 Linear (Self/Holism) 2010 2011 2012 2013 2015
Trend in ROSI Domain Scores - 2010-2015: Region 2 3.7 Region 2 Trends Scores have improved MOST for: Social Relationships Choice Meaningful Activities 3.6 3.5 Average ROSI Domain Score 3.4 And R = 0.20 R = 0.83 Meaningful Activities LEAST for: Formal Services Material Resources Basic Material Resources R = 0.00 3.3 Peer Support Choice 3.2 Formal Service Staff Scores DECLINED for Peer Support R = 0.58 Formal Services Social Relationships 3.1 Self/Holism Linear (Meaningful Activities) Linear (Basic Material Resources) 3.0 Linear (Peer Support) R = 0.34 R = 0.03 R = 0.05 Linear (Choice) 2.9 Linear (Formal Service Staff) R = 0.41 Linear (Formal Services) Linear (Social Relationships) 2.8 Linear (Self/Holism) 2010 2011 2012 2013 2015
Survey respondents who have been in services longer tend to rate their CSB as more recovery oriented, and CSBs that have shared their ROSI results had improved scores. Overall Score by Length of Time in Services An independent one-way analysis of variance (ANOVA) revealed a significant difference between average Overall Domain scores by Time in Services: F(df-1, n=16,241) = 33.85, p <.001 In Services 5 Yrs or Less N=5,569 2010 3.13 2011 3.18 2012 3.17 2013 3.17 2015 3.15 Overall Score by Whether CSB Shared ROSI Results An independent one-way analysis of variance (ANOVA) revealed a significant difference between average Overall Domain scores whether the CSB shared ROSI results or not by year: F(df-4, n=10,106) = 7.16, p =.007 In Services More than 5 Yrs N=10,674 Survey Year Survey Year CSB Did Not Share Results CSB Shared ROSI Results 3.17 2012 3.25 3.19 3.20 2013 3.15 3.22 3.22 2015 3.16 3.20 3.23 Total 3.18 3.20 3.21
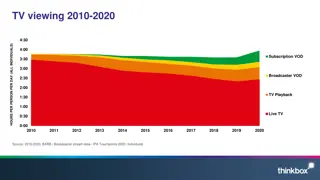
Trends in Overall ROSI Score by Time in CSB Services 3.24 Individuals who have been in services longer tend to perceive their CSB as more recovery oriented; and scores from those in services for more than 5 years have improved the most over time. R = 0.66 3.22 3.20 Overall Average Domain Score R = 0.03 3.18 R = 0.08 3.16 Less than 1 year R = 0.09 3.14 1 to 2 years 3 to 5 years More than 5 years Linear (Less than 1 year) 3.12 Linear (1 to 2 years) Linear (3 to 5 years) Linear (More than 5 years) 3.10 2010 2011 2012 2013 2015
In Addition to Overall Domain Scores, CSBs that Shared ROSI Survey Results with Individuals Receiving Their Services, Had Significantly Higher Scores for These Two Domains. Self/Holism An independent one-way analysis of variance (ANOVA) revealed a significant difference between average Self/Holism Domain scores by whether the CSB shared ROSI results or not by year: F(df-1, n=10,433) = 13.71, p <.001 Meaningful Activities An independent one-way analysis of variance (ANOVA) revealed a significant difference between average Meaningful Activities Domain scores by whether the CSB shared ROSI results or not by year: F(df-1, n=8,886) = 5.56, p =.018 CSB Did Not Share Results N=2,698 CSB Shared ROSI Results N=7,737 CSB Did Not Share Results N=2,291 CSB Shared ROSI Results N=6,597 Survey Year Survey Year 2012 3.10 3.01 2012 2.99 2.97 2.98 3.08 2013 2013 2.89 2.97 2.99 3.08 2015 2015 2.91 2.97 3.01 3.06 Total Total 2.92 2.97
Trend in ROSI Domain Scores by Year - CSBs that Shared ROSI Survey Results CSBS that shared their ROSI results with the individuals receiving their services are now rated as more recovery oriented and the 3.7 3.6 3.5 Meaningful Activities trends in their scores in almost every domain have improved over the 5 survey years. R = 0.60 R = 0.46 Basic Material Resources 3.4 Average ROSI Domain Score Peer Support R = 0.56 Choice 3.3 R = 0.77 Social Relationships Formal Service Staff 3.2 Formal Services Self/Holism Meaningful Activities 3.1 R = 0.86 R = 0.02 R = 0.88 Basic Material Resources Peer Support 3.0 Choice R = 0.51 Social Relationships Formal Service Staff 2.9 Formal Services Self/Holism 2.8 2011 2012 2013 2015
Trend in ROSI Domain Scores by Year - CSBs that Did Not Share ROSI Survey Results CSBS that did not share their ROSI results with the individuals receiving their services are now 3.7 3.6 3.5 Meaningful Activities rated as less recovery oriented and the trends in their scores in almost every domain have declined over the 5 survey years. Basic Material Resources 3.4 R = 0.19 Average ROSI Domain Score Peer Support R = 0.58 Choice R = 0.36 3.3 Social Relationships Formal Service Staff R = 0.57 3.2 Formal Services Self/Holism Meaningful Activities 3.1 Basic Material Resources R = 0.43 Peer Support R = 0.13 R = 0.70 3.0 Choice Social Relationships 2.9 Formal Service Staff R = 0.56 Formal Services Self/Holism 2.8 2011 2012 2013 2015
Summary of Findings from 2010-2015 Overall ROSI scores have improved with time, particularly in the domains of Formal Service Staff, Social Relationships, and Choice. Peer support domain scores have seen the least improvement statewide. Rural CSBs have consistently higher scores than Urban CSBs. Average domain scores in Region 3 have been consistently higher than the other regions domain scores. The longer that individuals have been receiving services from the CSB, the higher they tend to rate their CSB s overall recovery orientation. CSBs that shared ROSI results have seen improvements in almost every domain over time, with the exception of the Basic Material Resources domain. CSBs that did not share results have shown trends in scores that have declined over time, particularly for the Peer Support and Choice domains.