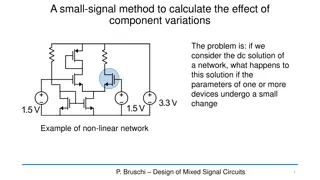
Small Signal Approach for Component Variations
Learn how to calculate the effects of component variations in non-linear networks using a small-signal method. Explore techniques to analyze parameter changes in devices like resistors and MOSFETs, enabling precise adjustments in network solutions.

Download Presentation

Please find below an Image/Link to download the presentation.
The content on the website is provided AS IS for your information and personal use only. It may not be sold, licensed, or shared on other websites without obtaining consent from the author.If you encounter any issues during the download, it is possible that the publisher has removed the file from their server.
You are allowed to download the files provided on this website for personal or commercial use, subject to the condition that they are used lawfully. All files are the property of their respective owners.
The content on the website is provided AS IS for your information and personal use only. It may not be sold, licensed, or shared on other websites without obtaining consent from the author.
E N D
Presentation Transcript
Help! Statistics! Lunchtime Lectures 10.01.2017 Which test when? Christine zu Eulenburg Medical Statistics and Decision Making UMCG
Help! Statistics! Lunchtime Lectures 17.01.2017 Help! Statistics! Lunchtime Lectures What? frequently used statistical methods and questions in a manageable timeframe for all researchers at the UMCG No knowledge of advanced statistics is required. When? Lectures take place every 2ndTuesday of the month, 12.00-13.00 hrs. Who? Unit for Medical Statistics and Decision Making When? Where? What? Who? Jan 10, 2017 Feb 14, 2017 3212.0217 3212.0217 Which test when? Some common misconceptions about p- values and confidence intervals C. zu Eulenburg H. Burgerhof Mar 14, 2017 Apr 11, 2017 Room 16 Mediation analysis S. la Bastide Slides can be downloaded from http://www.rug.nl/research/epidemiology/download-area 2
Help! Statistics! Lunchtime Lectures 17.01.2017 Which test when? The most important questions to answer: 1. What is the main study hypothesis? 2. Are the data independent? 3. What types of data are being measured? 3
Help! Statistics! Lunchtime Lectures 17.01.2017 Example: 1. What is the main study hypothesis? I have a great dataset! Let s see what s in there! 4
Help! Statistics! Lunchtime Lectures 17.01.2017 Example: 1. What is the main study hypothesis? I am interested in studying the difference between group 1 and group 2. 5
Help! Statistics! Lunchtime Lectures 17.01.2017 What is the main study hypothesis? Are you mainly interested in Afbeeldingsresultaat voor two group comparison histogram testing (differences in) measures of location? (means, medians, ) testing (differences in) variability? distributional assumptions? (test for normal distribution) outcome 6
Help! Statistics! Lunchtime Lectures 17.01.2017 What is the main study hypothesis? Afbeeldingsresultaat voor two group comparison histogram Frequently applied tests for testing differences in means: t-test (2 groups, normally distributed data) ANOVA (>2 groups, normally distributed data) Wilcoxon test Man-Whitney U test Kruskall Wallis } Nonparametric tests (Non-normal data) 7
Help! Statistics! Lunchtime Lectures 17.01.2017 Which test when? The most important questions to answer: 1. What is the main study hypothesis? Differences in means / medians / proportions between two or more groups, Hypotheses on distributions, correlations, regression coefficients, 2. Are the data independent? 8
Help! Statistics! Lunchtime Lectures 2. Are the data dependent or independent? Data are dependent when two specific observations are per se more similar to each other than two random other observations. 17.01.2017 Afbeeldingsresultaat voor twin party Families (LifeLines) Repeated measurements Patients within one centre Etc. For dependent variables, paired tests should be used. 9
Help! Statistics! Lunchtime Lectures 2. Are the data dependent or independent? 17.01.2017 The analysis should also reflect the study design: Afbeeldingsresultaat voor crossover trial In a cross-over trial and In a matched case-control study , tests for dependent data should be applied. In most RCTs, observations are independent Afbeeldingsresultaat voor menschenmenge 10
Help! Statistics! Lunchtime Lectures 17.01.2017 Example 1: A group of patients was measured before and after treatment of a new medication XY. Does medication XY lower the mean blood pressure? Repeated measurements of the same patients -> dependent observations! 11
Help! Statistics! Lunchtime Lectures 17.01.2017 Example 2: To compare treatments A and B for leg ulcers regarding the time to cure, 30 ulcers in 20 patients treated with A or B where retrospectively compared. -> Some patients have more than one ulcer -> Considering the ulcers as independent observations is not correct! Ignoring the cluster structure underestimates within-cluster variation overestimates between-cluster variation 12
Help! Statistics! Lunchtime Lectures 17.01.2017 Afbeeldingsresultaat voor klapperstorch Confounding: A swedish longterm study resulted in a higly significant correlation (p<0.001) between the number of storks and the number of births in communities. The observations are independent. But a third variable is strongly associated with both, the number of storks and birth. TIME is a confounder in this study and should be controlled for! 13
Help! Statistics! Lunchtime Lectures 17.01.2017 Which test when? The most important questions to answer: 1. What is the main study hypothesis? Differences in means / medians / proportions between two or more groups, Hypotheses on distributions, correlations, regression coefficients, 2. Are the data independent? Two legs of a patient, patients within one centre, repeated measurements over time, etc. are dependent! Are there confounding variables to control for? 3. What types of data are being measured? 14
Help! Statistics! Lunchtime Lectures 3. What types of data are being measured? Examples 17.01.2017 Treatment arm, blood group, Being alive (yes/no) It is helpful to answer the question of variable type for input variables and outcome variables! Nominal Test scores, Likert scales Ordinal Number of children, Weight in kg Percentages continuous Time to event Time to death 15
Help! Statistics! Lunchtime Lectures Frequently applied tests 17.01.2017 Afbeeldingsresultaat voor twin party Outcome variable Dependent observations Independent observations Chi2 Logistic Regression Nominal (e.g. cured yes/no) Ordinal (e.g. pain scale 1 to 5) Quantitative (e.g. blood pressure) Time-to-event (e.g. Time to death) Mc Nemar s test Wilcoxon sign test Man-Whitney-U t-test, ANOVA Lin. Regression Sign test Paired t-test Mixed model Kaplan-Meier Cox Regression Frailty Model 16 For some tests, assumptions have to be met!
Help! Statistics! Lunchtime Lectures 17.01.2017 Key assumptions for tests Tests Categorial (Chi2, McNemar, logistic regression) Assumptions Alternative Sufficient numbers in each cell (n>=5) Exact tests (Fisher s exact test, McNemar s exact test) Nonlinear models Nonparametric tests (sign-test, U- test, Kruskal- Wallis ) Linear relationship Normally distributed outcome (important for small samples) Equal variances Linear models (t-tests, ANOVAs, linear regression, mixed models, ) Cox regression assumes proportional hazards Time-dependent models Time-to-event (Kaplan-Meier, Cox) 17
Help! Statistics! Lunchtime Lectures 17.01.2017 Which test when in the web Usefull overviews can also be found at the UCLA homepage http://www.ats.ucla.edu/stat/mult_pkg/whatstat/ MGH Biostatistics homepage http://hedwig.mgh.harvard.edu/biostatistics/support/s tat-key 18
Help! Statistics! Lunchtime Lectures 17.01.2017 Parametric versus nonparametric tests Afbeeldingsresultaat voor gauss verdeling Many statistical test are based upon the assumption that the data are sampled from a Gaussian distribution. These tests are called parametric tests. (i.e. t-test, ANOVA, ) Tests not making this assumption are referred to as nonparametric tests. (i.e. Mann-Whitney, Wilcoxon, Kruskal Wallis, ) 19
Help! Statistics! Lunchtime Lectures 3. What types of data are being measured? 17.01.2017 Tests for normal distribution: Theoretical test: Kolmogorov-Smirnov-test Graphical tests: Histogram Q-Q Plot 20
Help! Statistics! Lunchtime Lectures 17.01.2017 Parametric versus nonparametric tests You should definitely choose a parametric test when you are sure that your sample comes from a normally distributed population, because parametric tests allow effect estimation parametric tests have more power parametric tests allow for covariate adjustment Some non-normal distributions can be transformed to normal. 21
Help! Statistics! Lunchtime Lectures 17.01.2017 Parametric versus nonparametric tests You should better choose a nonparametric test, when the outcome is a rank or score and clearly not Gaussian when extreme outliers are present 22
Help! Statistics! Lunchtime Lectures 17.01.2017 Parametric versus nonparametric tests What happens when I choose a parametric test (Distribution: non-normal) nonparametric test (Distribution: normal) Large sample No problem, robust test (central limit theorem) valid results, slightly too high p-values Small sample valid results, low statistical power Results are not valid! 23
Help! Statistics! Lunchtime Lectures 17.01.2017 Examples 1. Clinical Trial. Input variable: nominal, say type of treatment; outcome variable: clinical measure (normal), say blood pressure t-test 2. Observational study. Input variable: clinical measure (normal), say blood pressure; outcome variable: nominal, say cured (yes/no) logistic regression t-test? 3. Cross-sectional study. Input variable: nominal, say sex, outcome variable: Ordinal, say rating of their general practitioner on a five- point scale Man-Whitney-U test / t-test (But what if some go to the same GP?) 24
Type I and Type II Error in a box Your Statistical Decision True state of null hypothesis H0True H0False (example: the drug works) (example: the drug doesn t work) Reject H0 (ex: you conclude that the drug works) Correct Type I error ( ) Do not reject H0 (ex: you conclude that there is insufficient evidence that the drug works) Type II Error ( ) Correct 25
Help! Statistics! Lunchtime Lectures 17.01.2017 Error and Power Type I error rate (or significance level): the probability of finding an effect that isn t real (false positive). If we require p-value<.05 for statistical significance, this means that 1/20 times we will find a positive result just by chance. Type II error rate: the probability of missing an effect (false negative). Statistical power: the probability of finding an effect if it is there (the probability of not making a type II error). When we design studies, we typically aim for a power of 80% (allowing a false negative rate, or type II error rate, of 20%). 26
Help! Statistics! Lunchtime Lectures 17.01.2017 The next Help! Statistics! Lecture: Hans Burgerhof: Some common misconceptions about p-values and confidence intervals Tuesday, 14 February 2017, 12.00 13.00 Room 3212.0217 UMCG 27
Help! Statistics! Lunchtime Lectures 17.01.2017 28


![Importance of Rock v. MWB [2018] UKSC 24 as Explained by Lord Sumption](/thumb/193348/importance-of-rock-v-mwb-2018-uksc-24-as-explained-by-lord-sumption.jpg)