Snapshot of Residential Wi-Fi Activity in March 2016
Explore a detailed analysis of residential Wi-Fi activity in March 2016 based on data collected from dual-band AP/Gateway devices. Discover insights into traffic distribution, device usage trends, and more for IEEE 802.11 simulation scenarios and goals.

Download Presentation

Please find below an Image/Link to download the presentation.
The content on the website is provided AS IS for your information and personal use only. It may not be sold, licensed, or shared on other websites without obtaining consent from the author. If you encounter any issues during the download, it is possible that the publisher has removed the file from their server.
You are allowed to download the files provided on this website for personal or commercial use, subject to the condition that they are used lawfully. All files are the property of their respective owners.
The content on the website is provided AS IS for your information and personal use only. It may not be sold, licensed, or shared on other websites without obtaining consent from the author.
E N D
Presentation Transcript
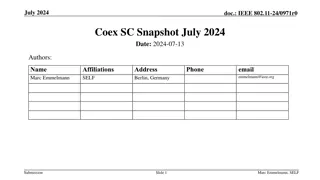
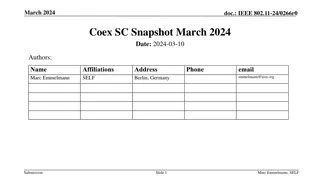
March 2016 doc.: IEEE 802.11-16/0355r0 Snapshot of Residential Wi-Fi Activity - 2016 Date: 2016-03-12 Name Affiliation Address Phone Email ARRIS 3871 Lakefield Dr, Suwanee, GA Carol Ansley +1-678-473-8630 carol.ansley@arris.com International, plc Submission C. Ansley (ARRIS), Slide 1 C. Ansley (ARRIS)
March 2016 doc.: IEEE 802.11-16/0355r0 Introduction Data was gathered from a recent deployment in a North American residential setting. This presentation provides a snapshot of some of the data that is relevant to 11ax simulation scenarios and goals. This snapshot of current behavior can be compared to the simulation models as a checkpoint. Submission Slide 2 C. Ansley (ARRIS)
March 2016 doc.: IEEE 802.11-16/0355r0 Data Background Data was gathered from 1040 recently deployed dual band/concurrent AP/Gateway devices. Devices were polled 4 times a day to minimize load on monitoring system. Data was collected from January 23rd through January 30th, 2016. STA data only includes traffic to/from STAs. Other traffic, like beacons and other MAC traffic, was not included. Submission Slide 3 C. Ansley (ARRIS)
March 2016 doc.: IEEE 802.11-16/0355r0 STA Traffic by Band Highest traffic level during primetime . Most traffic still traverses the 2.4GHz radio. While the volume of traffic changes, the percentage split across 2.4GHz versus 5 GHz remains fairly constant. Submission Slide 4 C. Ansley (ARRIS)
March 2016 STA Statistics by Band doc.: IEEE 802.11-16/0355r0 Count of STAs per AP varies across the day. The ratio of 5GHz STAs to 2.4GHz STAs is almost unchanged across the day. Note the 5GHz STAs are 20% of total STAs, but account for about 40% of total packets. Submission Slide 5 C. Ansley (ARRIS)
March 2016 doc.: IEEE 802.11-16/0355r0 General STA statistics Compared with earlier measurements, overall STAs/AP has not grown much 6.6 STAs/AP 2.4 GHz + 5 GHz 5 GHz may be spreading slowly 3% of APs were 5GHz only 44% of APs were 2.4GHz only Because this deployment was recent, users may still have had other APs in use. Submission Slide 6 C. Ansley (ARRIS)
March 2016 doc.: IEEE 802.11-16/0355r0 Summary Wi-Fi traffic in residential areas is time of day dependent. Portion of STA population tends to migrate away during the day which suggests they are mobile devices the owner tends to take with them. While 5GHz devices are spreading in the network and accounting for more than their fair share of traffic, 2.4GHz devices still predominate in sheer numbers as well as traffic. Submission Slide 7 C. Ansley (ARRIS)
March 2016 doc.: IEEE 802.11-16/0355r0 References None. Submission Slide 8 C. Ansley (ARRIS)